

Using data obtained from the Illinois Department of Public Health’s website on 4/12/20 and the preceding days, we established a regularly updated summary of the fastest growing Zip Codes in Illinois sorted by 2 day growth rate and filtered by Zip Codes that have passed 100 diagnosed COVID-19 / Coronavirus positive cases.
Our analysis of the top fastest growth Zip Codes that all have experienced an average growth rate at or in excess of 10% led us to cross reference the population. Of those fastest growing 19 Zip Codes from 4/10 to 4/12, the combined population is majority Hispanic. This finding doesn’t negate that the black community is being devastated by this pandemic in greater numbers at present in Chicago, but does suggest transmission rates may be greater within the Hispanic community. This information means that communities with rapidly growing Coronavirus cases need to take immediate steps to ensure essential workers are being provided appropriate training, protective equipment and rapid testing. Many businesses in economically struggling communities are failing to protect their workers and customers and this needs to change promptly. Resources need to be prioritized to brown and black communities being disproportionately impacted by this outbreak.
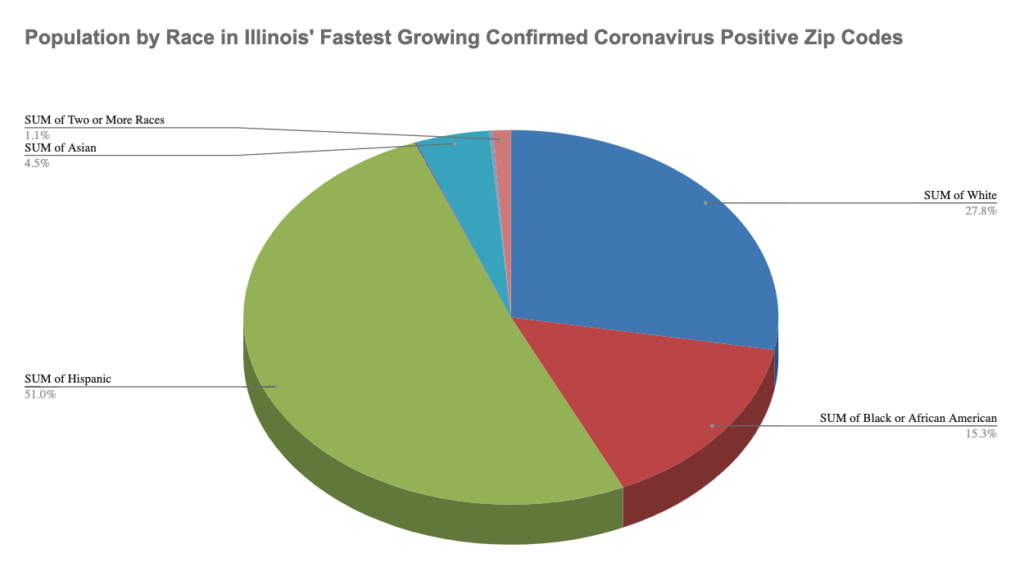
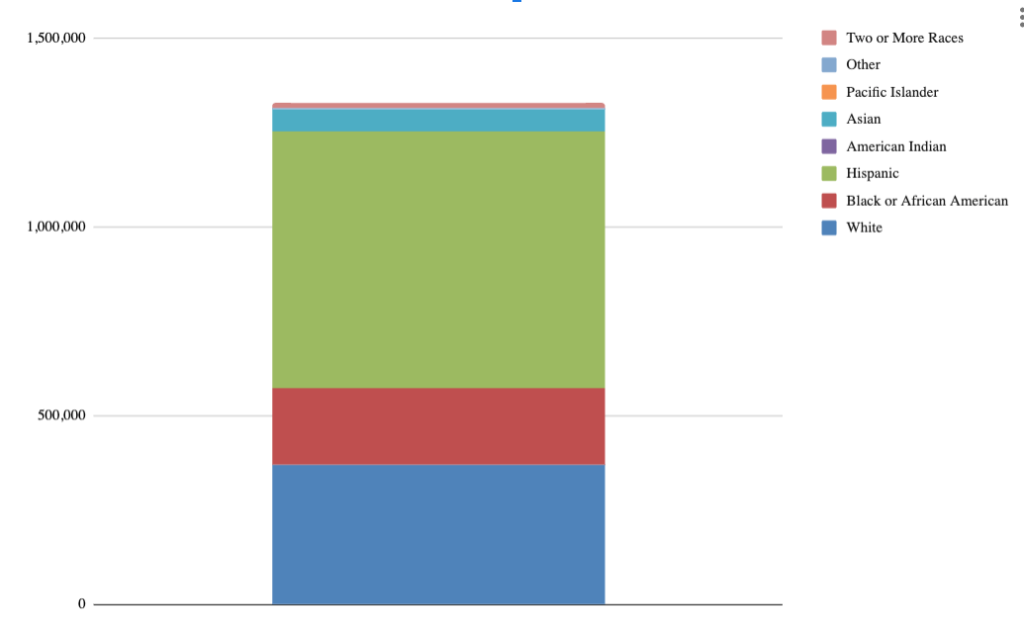
Population Totals for the 19 Fastest Growing Coronavirus Confirmed Positive Zip Codes in Illinois
| White | 369,243 |
| Black or African American | 203,409 |
| Hispanic | 678,050 |
| American Indian | 1,158 |
| Asian | 59,386 |
| Pacific Islander | 248 |
| Other | 2,447 |
| Two or More Races | 14,668 |
[visualizer id=”7648″]
View the most recent updated Illinois COVID-19 Statistics
Hello Lee. Great job.
Can you be able to add another column to your 2nd table that will contain for each ranking community, the % of the neighborhood population that is White (non-Hispanic), % of Blacks non-Hispanics, and the % Hispanics/Latinos. That will help to better interpreter understand the results. Thank you.
Aida
Hello Aida,
We are working on it. Thank you for your comment.