Today’s Top 10 Growth Zip Codes for COVID-19

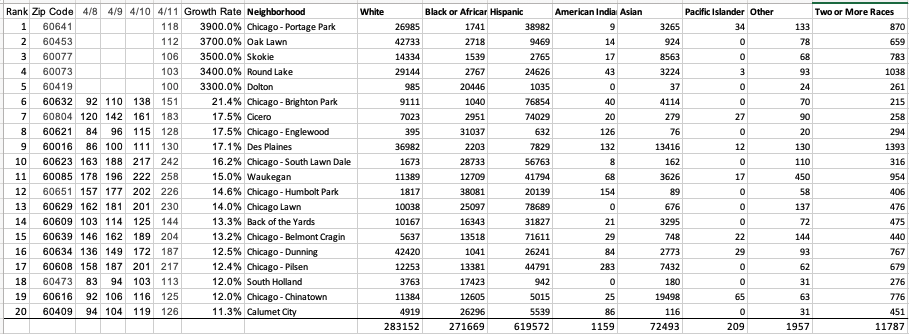
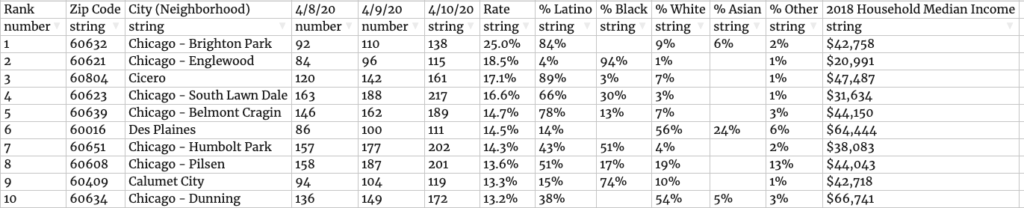
The chart below shows new COVID-19 confirmed positive cases in Illinois. This data has been filtered to include only Zip Codes that report 100 or more positive cases and is reversed sorted by the 2 day trailing growth rate, highest to lowest.

Notable top communities outside Chicago include Des Plaines, and new to the top 10 list:

  • Kankakee
  • Willow Brook
  • Bolingbrook

[visualizer id=”7739″]

COVID-19 Account for 60% of Latino Neighborhoods

In early April, Latino communities in Chicago experienced a fast growing number of COVIS-10 Cases.

As of 4/14/20, the Top Fastest growing Illinois Zip Codes reporting new COVID-19 cases shifted disproportionately to Latino populations based on the ethnic racial makeup of those Zip Codes. The CDC needs to immediately begin releasing detailed data on actual confirmed Coronavirus positive cases and deaths by Zip Code to help effectively target emerging hot pockets. There remains no available data reporting death’s by zip code impacting the Latino community.

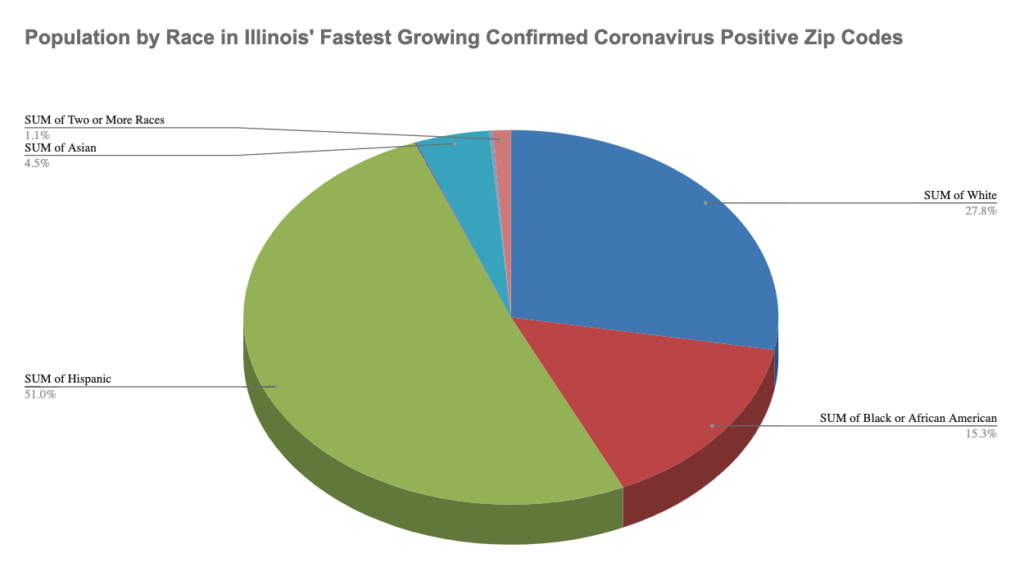
Of the 710,648 people that live in the top 10 Zip Codes (2014 Census estimates from https://zipdatamaps.com/), the racial break down of these combined communities is as follows:

Racial Group2014 Population% of Population
White159,87022%
Black or African American76,32311%
Hispanic / Latino428,16960%
All Others46,2867%
All Groups Top 10 Zip Codes710,648
Source data Illinois Department of Public Health compiled daily by Enigma Forensics to report 2 day trailing growth rates of the virus.

This new data suggests that Mayor Lightfoot’s campaign targeting African American and other communities has been highly effective at slowing growth rates in many majority African American and other neighborhoods where English is broadly spoken. The growth rates in majority Latino neighborhoods suggests similar outreach efforts and analysis is needed targeting Latino neighborhoods where the virus is growing at the highest rates across Illinois.

Yesterday, a coalition of Latino leaders issued a press release calling on such a well needed outreach campaign to address the unique cultural and language needs of the Latino communities.

Other observed trends from yesterday’s data is the emergence of University Village into the top position for fastest growing Zip Code statewide at an alarming rate of 27% daily growth over the most recent 2 day period. We speculate that this may be a result of UIC and possibly the increase in availability of rapid testing in that zip code.

[visualizer id=”7708″]

Coronavirus Case Growth Highest in Hispanic Communities

Hispanic Communities are getting hit hard with COVID-19, they have the fastest growth of all the combined population. See the data.

Using data obtained from the Illinois Department of Public Health’s website on 4/12/20 and the preceding days, we established a regularly updated summary of the fastest growing Zip Codes in Illinois sorted by 2 day growth rate and filtered by Zip Codes that have passed 100 diagnosed COVID-19 / Coronavirus positive cases.

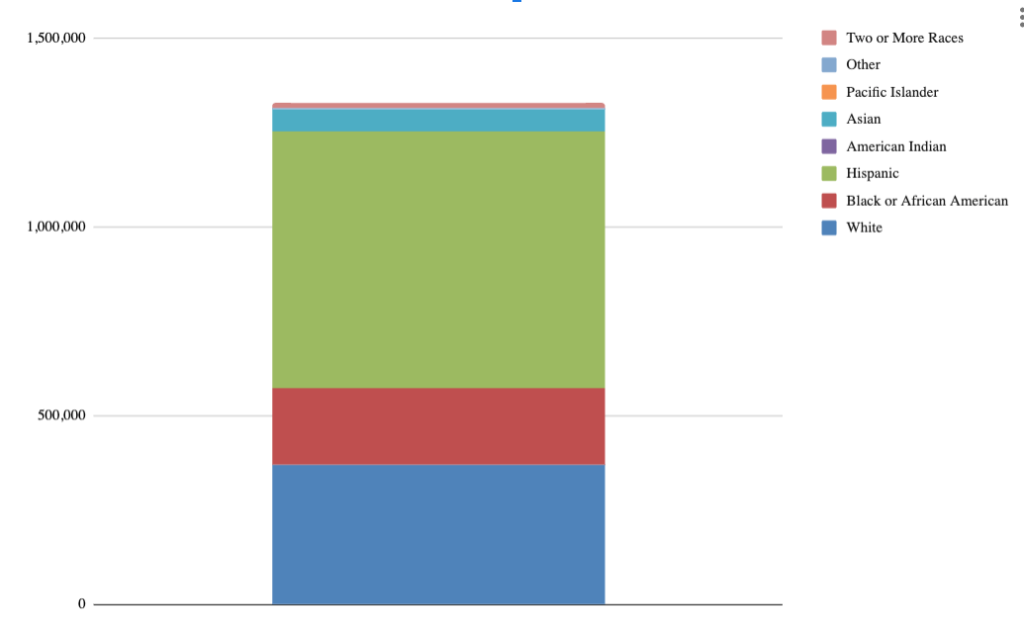
Our analysis of the top fastest growth Zip Codes that all have experienced an average growth rate at or in excess of 10% led us to cross reference the population. Of those fastest growing 19 Zip Codes from 4/10 to 4/12, the combined population is majority Hispanic. This finding doesn’t negate that the black community is being devastated by this pandemic in greater numbers at present in Chicago, but does suggest transmission rates may be greater within the Hispanic community. This information means that communities with rapidly growing Coronavirus cases need to take immediate steps to ensure essential workers are being provided appropriate training, protective equipment and rapid testing. Many businesses in economically struggling communities are failing to protect their workers and customers and this needs to change promptly. Resources need to be prioritized to brown and black communities being disproportionately impacted by this outbreak.

Population Totals for the 19 Fastest Growing Coronavirus Confirmed Positive Zip Codes in Illinois

White369,243
Black or African American203,409
Hispanic678,050
American Indian1,158
Asian59,386
Pacific Islander248
Other2,447
Two or More Races14,668
Click Excel link below to see the complete data

[visualizer id=”7648″]

View the most recent updated Illinois COVID-19 Statistics

Related Articles

Latino Communities in Chicagoland are Experiencing The Greatest Growth of Coronavirus Cases

Chicagoland Latino Community on track to lead in COVID-19 Deaths. Quick action is needed to educate and protect the Latino Community. View these actions to help save lives.

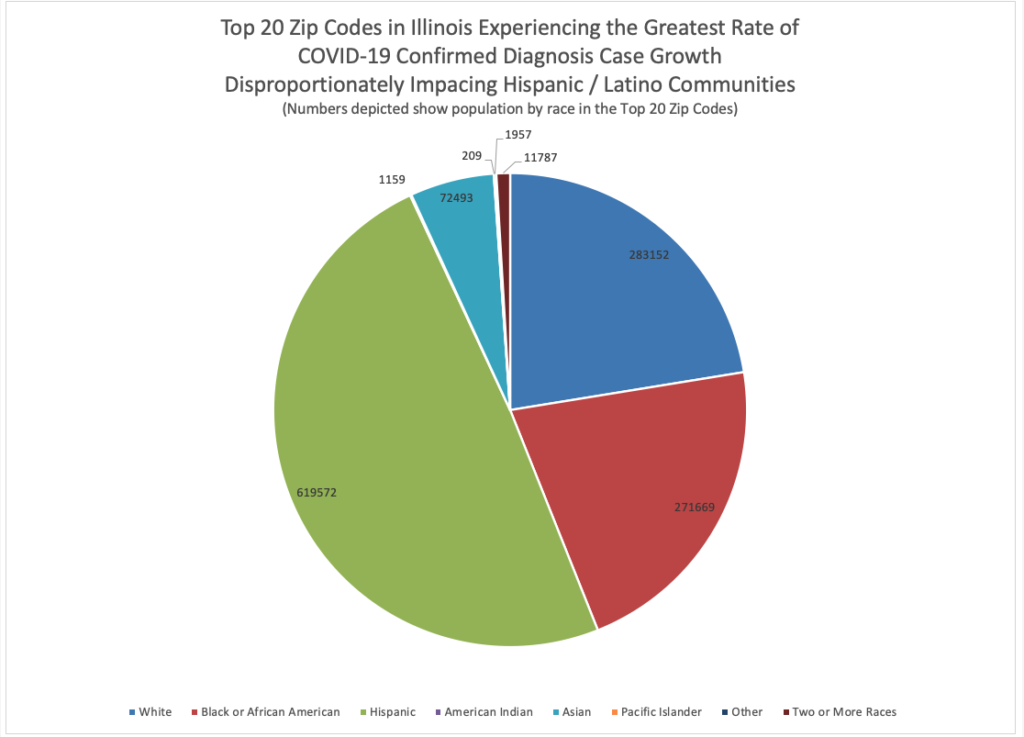
The Illinois Department of Public Health issued an update today with the latest count of confirmed Coronavirus test positive cases including numerous new Zip Codes that made the list. We analyzed and updated the top 20 emerging Illinois Zip Codes and see a significant pattern emerging. We excluded from our ranking any Zip Code that hasn’t reported 100 or more confirmed positive cases. The top 20 communities on our list have more than twice as many Latinos than any other race impacted by the virus.

Latino communities are ranking in the top fastest growing areas reporting positive tests for the Coronavirus. Something needs to happen fast to help protect this vital part of our community that is being impacted at a growing rate by the virus.

  • All vital stores should have chalk or tape markings outside store entrances delimiting 6 feet minimum spacing
  • Stores need to take accountability for ensuring customers maintain 6 feet of spacing
  • Cashiers, clerks, stock persons, food service workers all need employer provided protective masks and gloves
  • Stores should implement mask only hours to protect those that are the most vulnerable
  • Government agencies need to spot check and enforce these measures in the short term
  • More rapid 5 minute tests need to be made available to anyone with a fever in these emerging areas
  • Essential business should be required to conduct daily temperature checks at the start of the work day for each employee.

The previous measures if implemented would slow this down.

Data originates from https://www.zipdatamaps.com/ and depicts the total population counts reported from 2014 census estimates compiled by zipdatamaps.com for the top 20 fastest 3 day average growth rates reported.

Zip Codes having fewer than 100 Confirmed Coronavirus Positive Cases were excluded from today’s ranking by growth Top 20

Zip Codes with less than 100 Confirmed Cases as of 4/11/20 were excluded from the ranking based on daily average growth rate, highest to lowest.

Demographic data for each Zip Code obtained from https://www.zipdatamaps.com/
Daily counts of Confirmed Coronavirus cases taken daily since 4/8/20 from the Illinois Department of Public Health. https://www.dph.illinois.gov/covid19/covid19-statistics

Click Excel Button at Bottom to View All Data

[visualizer id=”7598″]

View All Illinois Zip Codes with More than 100 Coronavirus Cases

Top 10 Coronavirus Confirmed Positive Growth Zip Codes in Illinois

The following data was compiled using the Illinois Department of Public Health’s daily statistics showing Coronavirus / COVID-19 Confirmed Positive Statistics taken from each of the last three day reports. The ranking is based on the 2 day average daily growth rate. Demographic data has been added from the website illinois-demographics.com to help better understand the communities impacted. The data shows statistics reported as of April 10th, 2020.

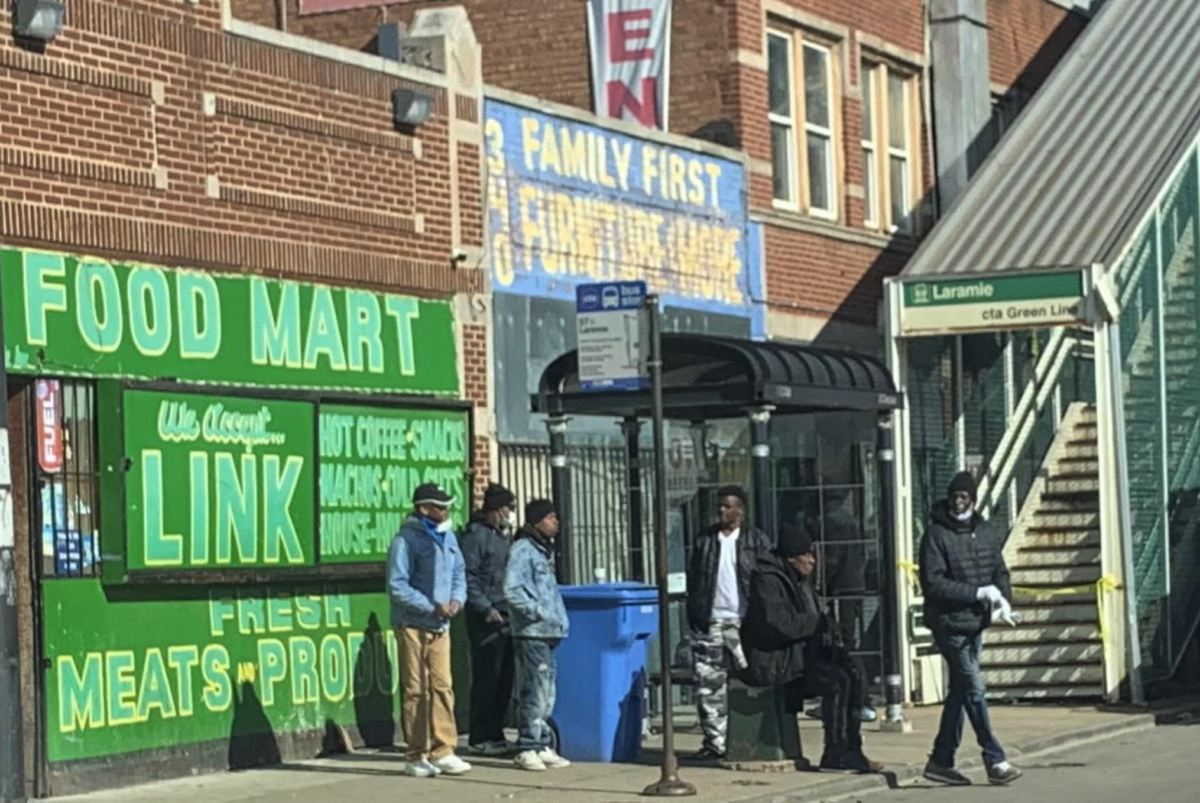
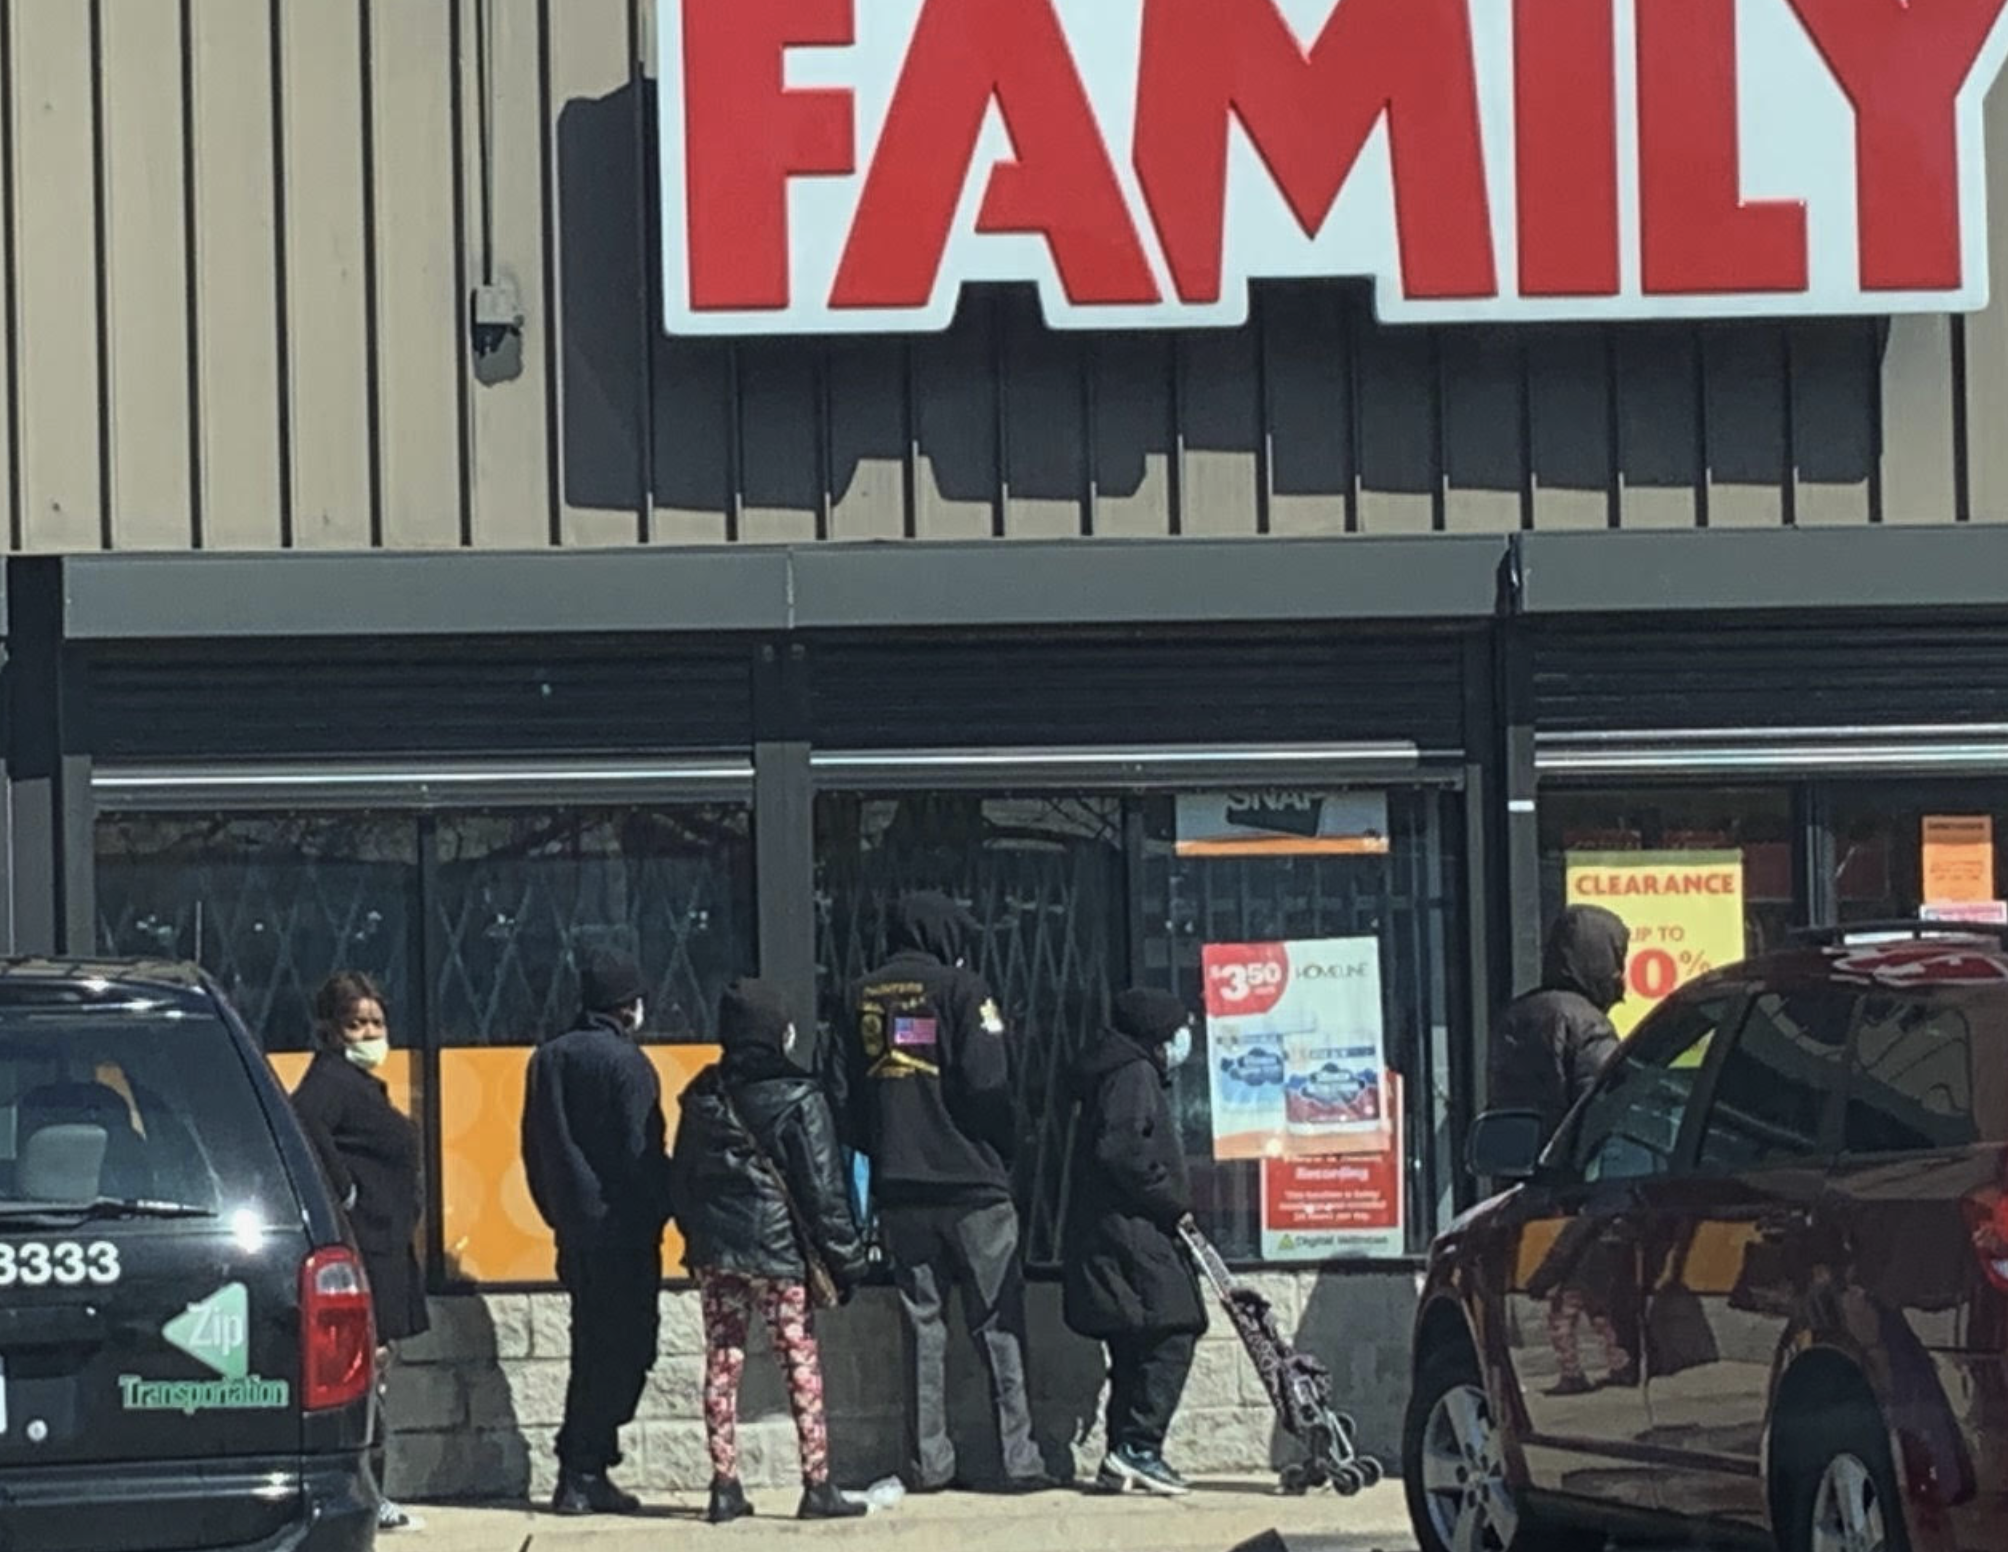
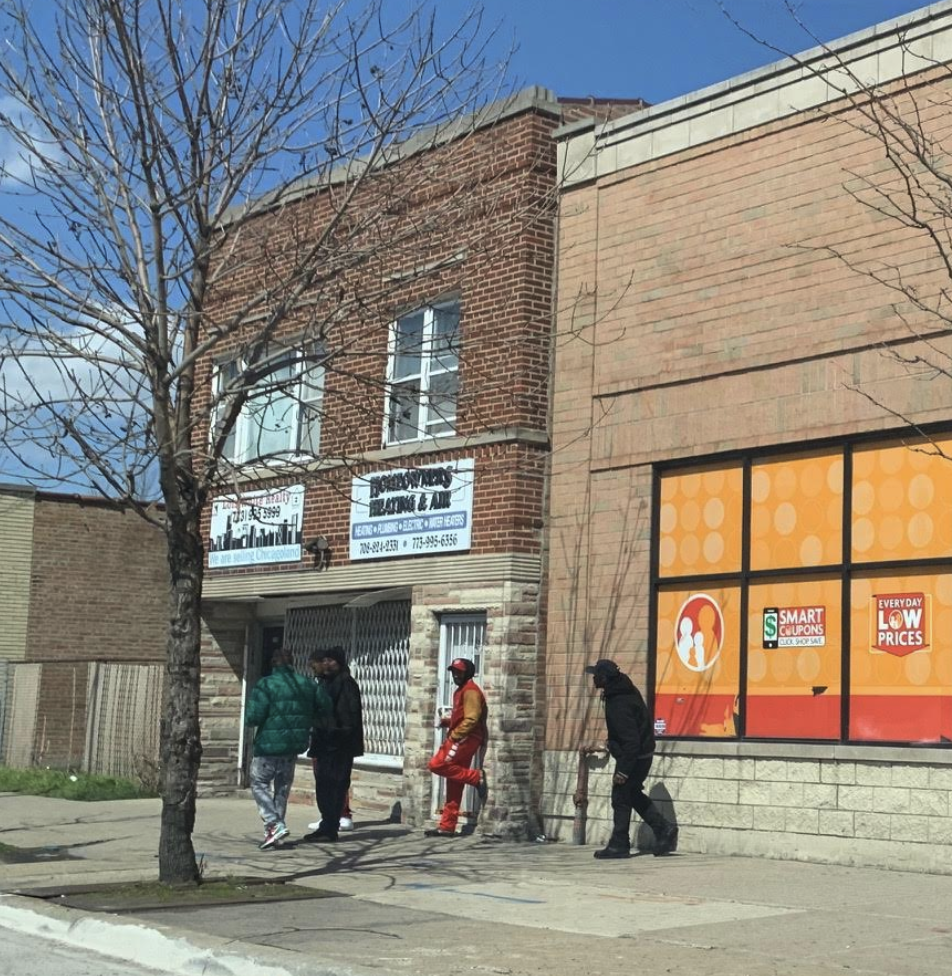
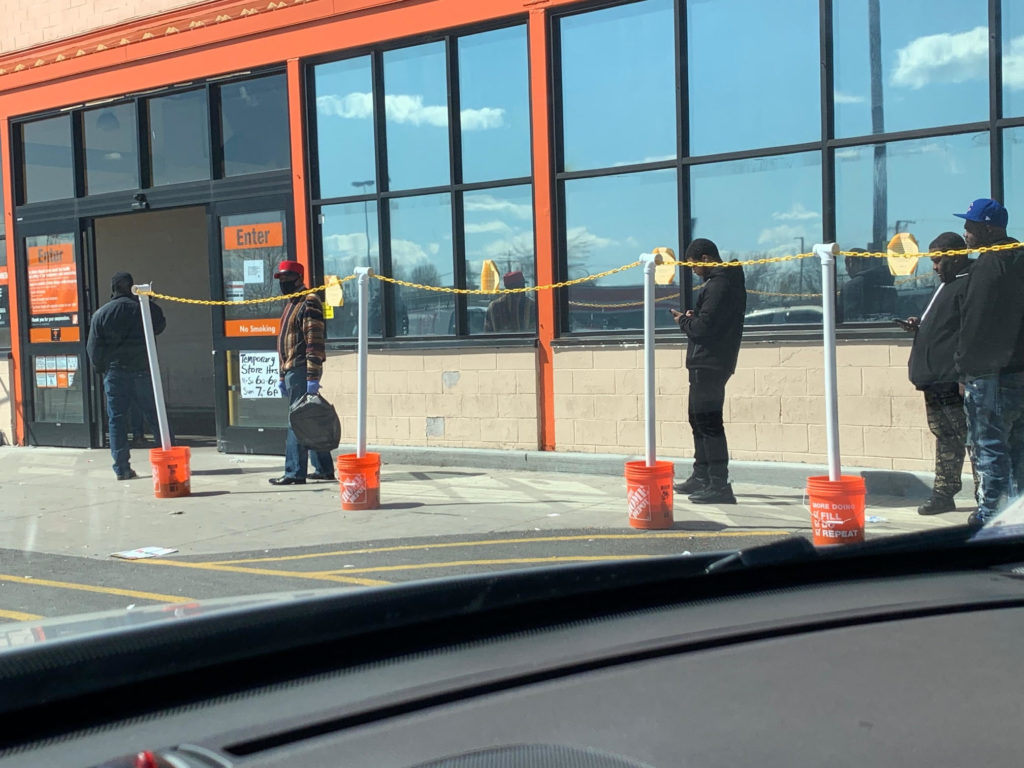
Yesterday I spent time driving into some of the Zip Codes that were experiencing the greatest growth rates that reported 100 or more Coronavirus confirmed positive tests. I observed a lack of social distancing with many young African American men not practicing social distancing or wearing protective masks or gloves congregating outside various essential businesses like retail stores and liquor stores. I observed an instance amongst young male Latinos as well. I observed problems at shopping centers with essential staff not having protective clothing or enforcing social distancing at the entrances or inside their stores. Customers entering stores generally are not wearing protective wraps around their faces.

It appears that these locations are economically disadvantaged largely. The residents of these zip codes need help in being educated on prevention measures to curtail the expanding growth rates of the Coronavirus. Businesses operating may need government inspectors to enforce social distancing recommendations through outreach. Ticketing of individuals willfully disregarding social distancing measures in larger groups may be necessary. The State of Illinois should prioritize deployment of the new Rapid 5 minute test equipment to suspected Coronavirus patients in these zip codes to more effectively curtail the growth of the virus to the general surrounding population. Essential service workers need to be wearing protective covering of some sort to help minimize and slow the virus transmission. A ban on shopping to customers not wearing protective coverings may need to be considered in the highest growth areas to protect those residents.

Click the Excel button below to copy the data above into a sortable spreadsheet.

[visualizer id=”7568″]

View all Illinois Zip Codes with 100 or more Coronavirus Confirmed Positive Cases ranked from fastest growing to slowest growing.

Latino Communities Taking the Lead in COVID-19 Rate of Growth

Fastest Growing Zip Codes with more than 100 confirmed Coronavirus cases

The fastest growing zip code with more than 100 confirmed positive diagnosis for COVID-19 is 60632. Brighton Park is the Chicago Community just East of Chicago Midway Airport. 88% of the population in this Zip Code is Latino. The runner up, 60608 which includes the Pilsen neighborhood and has just over 50% of the population identified as Hispanic or Latino. In third place is 60804 which is Cicero’s Zip Code. 60804 is 85% Hispanic of Latino.

State RankingZip Code4/8/204/9/20Net Change
160632, (East of Midway) Chicago, IL9211019.6%
260608, (Pilsen) Chicago, IL15818718.4%
360804 Cicero, IL12014218.3%
4600168610016.3%
56062316318815.3%
6606169210615.2%
76062415117113.2%
86061411412913.2%
96061215617612.8%
106065115717712.7%

See the latest rankings for all of Illinois

Top 10 Illinois Zip Codes with Largest Confirmed Corona Positive Cases

The Illinois Department of Public Health has begun publishing zip code level Coronavirus / COVID-19 Confirmed Positive cases. This data was captured as of 4/8/2020 4:15PM from http://www.dph.illinois.gov/covid19/covid19-statistics

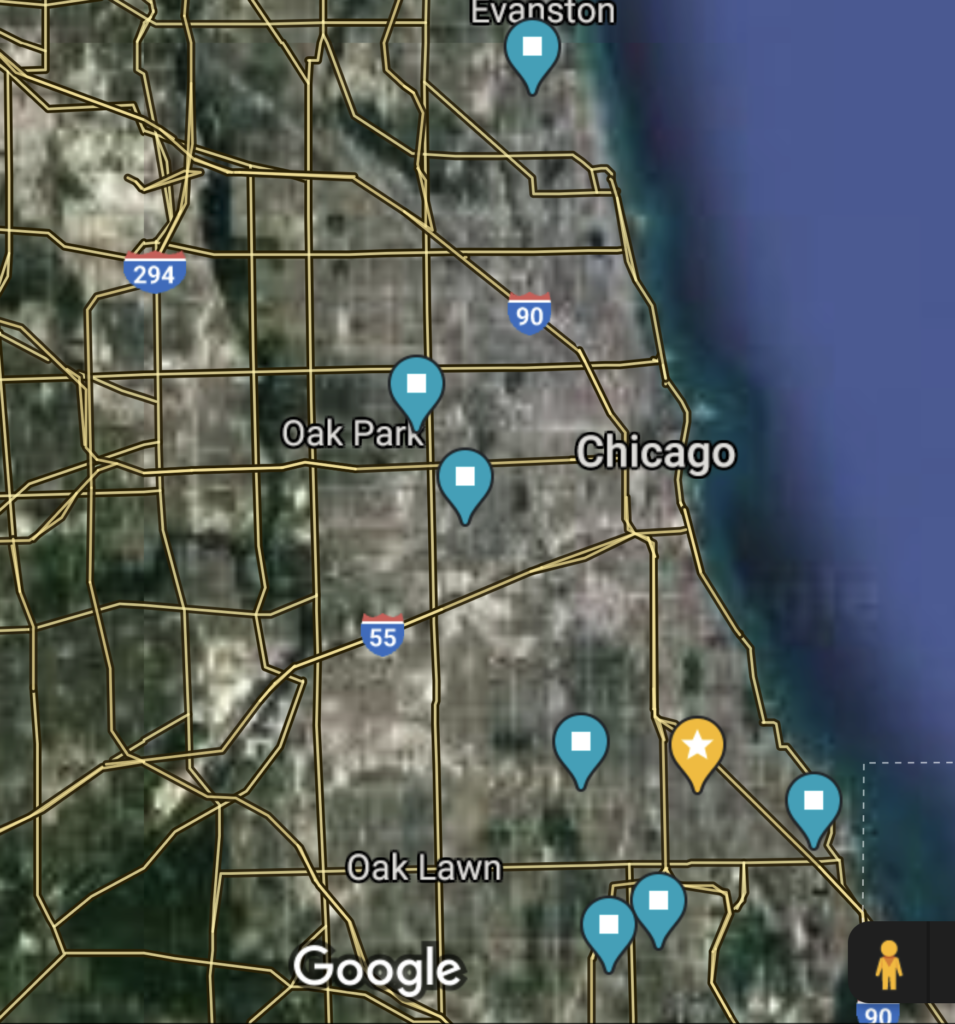
The top 10 Zip Codes in Illinois reporting the highest number of Coronavirus / COVID-19 Confirmed Positive Cases

Top Cook County Locations Where Coronavirus / COVID-19 Confirmed Cases have been reported.
Zip CodePositive CasesCity – Neighborhood – CountyPeople per sq mile% of Population in Zip Code Black
60645272Chicago – West Ridge – (Cook)20,05514%
60620269Chicago – Auburn Gresham – (Cook)10,19198%
60619238Chicago – Chatham – (Cook)10,60197%
60628229Chicago – Roseland – (Cook)6,61295%
60617209South Chicago – (Cook)6,07056%
60644184Chicago – Austin – (Cook)13,88594%
60085178Waukegan – (Lake)4,79119%
60643178Beverly – (Cook)6,80075%
60623163Chicago – South Lawndale (Cook)17,19633%
60629162Chicago – Chicago Lawn (Cook)16,72623%
Six out of the top ten zip codes in Illinois with the highest total confirmed Coronavirus confirmed positive cases are majority black / African American population centers. Income, population, density and race appear to be factors in test positive rates. Incarceration rates by zip code we plan to look into as well to see if there appears to be a correlation. African Americans make up a disproportionate part of the prison population. This seems to be impacting them at a much higher rate.

Waukegan may be higher due to it being home to Abbott Laboratories which recently reported availability of Coronavirus rapid 5 minute test units.

Social Distancing Photos in Hot Zones

60644 Chicago Austin Photo Taken @ 4/9/20 9:30AM

60628 Chicago 100 W. 95th @ 4/9/20 10:30AM

60620, Family Dollar, 7927 S Ashland Ave, Chicago, IL 60620 @ 4/9:20 10:30AM

60620 Home Depot taking appropriate measures 200-232 W 87th St Chicago, IL 60620

State Ranking Coronavirus / COVID-19 Zip Codes reporting more than 5 Confirmed Positives as of 4/9/20

State RankingZip Code4/8/204/9/20Net Change
1606202692928.6%
2606452722854.8%
36061923826511.3%
4606282292383.9%
5606172092268.1%
66064418420410.9%
76008517819610.1%
8606431781927.9%
96062316318815.3%
106060815818718.4%
116062916218111.7%
126065115717712.7%
136061215617612.8%
146062415117113.2%
15604111581686.3%
166063914616211.0%
176064914716210.2%
18606341361499.6%
19606181351425.2%
206080412014218.3%
21606371241369.7%
22606591321341.5%
23606251281333.9%
246063611713011.1%
256061411412913.2%
26606571201243.3%
27604021151237.0%
286062211012311.8%
296046611012210.9%
30606521161214.3%
316065310811910.2%
326060910311410.7%
33606131071146.5%
34604431011119.9%
35606329211019.6%
36606151091090.0%
3760638991089.1%
38606401011075.9%
39606169210615.2%
40604099410410.6%
4160076961026.3%
4260435981024.1%
4360025971014.1%
4460104921019.8%
45600168610016.3%
4660901921008.7%
476062694984.3%
486045388969.1%
4960621849614.3%
5060473839413.3%
516064788935.7%
526052786904.7%
536007781888.6%
5460440788610.3%
556082782864.9%
566041978859.0%
576063080845.0%
586064176816.6%
596061078802.6%
606020177770.0%
6160655667716.7%
626003576760.0%
6360153657616.9%
646070774762.7%
656007374751.4%
666060770757.1%
6760426657413.8%
686047868748.8%
6960099637112.7%
706043866717.6%
716009369701.4%
726006862689.7%
736066063664.8%
7460087536522.6%
7560101546316.7%
76604296563-3.1%
7760586556314.5%
786006258615.2%
7960506526117.3%
806009160600.0%
816020258603.4%
8260446495920.4%
836061158591.7%
846063155597.3%
856047155585.5%
866004556571.8%
876006456571.8%
886043054575.6%
896071452567.7%
9060148495512.2%
9160406505510.0%
926015451545.9%
936044151545.9%
946001552531.9%
9560302465213.0%
9660462425121.4%
976005649502.0%
986064648504.2%
996018847494.3%
1006042345498.9%
1016042845498.9%
10260656424916.7%
1036060546484.3%
1046009045474.4%
1056016044464.5%
1066005343454.7%
1076045542457.1%
1086008941447.3%
10960431404410.0%
1106049042444.8%
11160026394310.3%
1126003142432.4%
11360133374316.2%
11460459384313.2%
11560525364319.4%
11660805384313.2%
1176001840425.0%
1186043341422.4%
1196010639415.1%
1206012037408.1%
1216012338405.3%
1226012637408.1%
1236013937408.1%
1246018540400.0%
1256040339402.6%
1266065439402.6%
12760107333918.2%
1286013036398.3%
1296013137395.4%
1306018138392.6%
13160477353911.4%
1326042536385.6%
1336045235388.6%
13460565303826.7%
1356071237382.7%
13660505293727.6%
13760164283628.6%
1386019335362.9%
13960484313616.1%
14060706313616.1%
1416004633356.1%
1426007432359.4%
1436042232359.4%
1446056132359.4%
1456041731349.7%
1466049131349.7%
1476051732346.3%
14860004303310.0%
14960048303310.0%
15060463283317.9%
15160467293313.8%
1526056432333.1%
15360007293210.3%
15460098273218.5%
15560432283110.7%
15660475283110.7%
1576006028307.1%
1586054329303.4%
1596060128307.1%
16060047262911.5%
16160439242920.8%
1626013728280.0%
1636045126287.7%
1646050427283.7%
16560516232821.7%
16660544252812.0%
1676055927283.7%
16860563252812.0%
1696044525278.0%
1706046525278.0%
1716048725278.0%
1726001424268.3%
1736016225264.0%
1746040425264.0%
1756041524268.3%
1766064225264.0%
1776170125264.0%
17860061222513.6%
1796010223258.7%
1806010324254.2%
1816051325250.0%
1826124423258.7%
18360044212414.3%
1846015523244.3%
18560436212414.3%
18660448212414.3%
1876063322249.1%
18860803212414.3%
1896003022234.5%
1906017222234.5%
1916046123230.0%
19260585202315.0%
1936001321224.8%
19460084192215.8%
1956054622220.0%
1966091422220.0%
197628010222200.0%
19860005172123.5%
19960010192110.5%
20060108192110.5%
2016018920215.0%
20261265172123.5%
20360050162025.0%
2046017119205.3%
20560194182011.1%
2066052119205.3%
2076256820200.0%
20862901162025.0%
2096017519190.0%
2106040118195.6%
2116044918195.6%
2126045719190.0%
21360515171911.8%
21460540171911.8%
21562040171911.8%
21660008161812.5%
2176043417185.9%
21860472161812.5%
2196051417185.9%
2206182217185.9%
22162226141828.6%
22262233141828.6%
22362236718157.1%
2246005116176.3%
2256006717170.0%
226601691817-5.6%
2276030416176.3%
2286052317170.0%
2296120117170.0%
2306011516160.0%
23160418141614.3%
23260502131623.1%
2336053216160.0%
2346066116160.0%
2356176116160.0%
2366222116160.0%
23762269141614.3%
2386000214157.1%
23960156131515.4%
2406044214157.1%
2416229814157.1%
2426008313147.7%
24360110101440.0%
2446017414140.0%
24561704121416.7%
24662002121416.7%
24762223111427.3%
2486002213130.0%
2496013413130.0%
250601421413-7.1%
2516017613130.0%
252602031413-7.1%
2536052612138.3%
2546004312120.0%
2556016581250.0%
25660458101220.0%
25760501101220.0%
2586056012120.0%
2596108112120.0%
2606202511129.1%
2616220811129.1%
26260012101110.0%
2636006911110.0%
26460081101110.0%
2656012411110.0%
2666054291122.2%
2676060611110.0%
2686002010100.0%
2696014010100.0%
2706017710100.0%
2716030591011.1%
2726046491011.1%
2736048281025.0%
2746050310100.0%
2756053871042.9%
2766095081025.0%
2776110271042.9%
2786180110100.0%
2796182110100.0%
2806220691011.1%
281622341110-9.1%
2826270281025.0%
28360070990.0%
28460118990.0%
28560163990.0%
286604698912.5%
287605347928.6%
28860558990.0%
28961802990.0%
290626508912.5%
29160136880.0%
292601737814.3%
29360178880.0%
29460301880.0%
29560410880.0%
296604507814.3%
29762278880.0%
2986230508800.0%
29960042770.0%
30060191770.0%
30160192770.0%
30260468770.0%
30360510770.0%
30460545770.0%
30560554770.0%
306609646716.7%
307611096716.7%
30861241770.0%
3096176407700.0%
31062220770.0%
31162258770.0%
31262265770.0%
3136230107700.0%
31462711770.0%
3156011906600.0%
31660143660.0%
31760187660.0%
31860551660.0%
31960555660.0%
3206103206600.0%
3216110306600.0%
32261114660.0%
32361282660.0%
32461853660.0%
32561910660.0%
3266203406600.0%
32762035660.0%
32862959660.0%
329600416 -100.0%
330620956 -100.0%