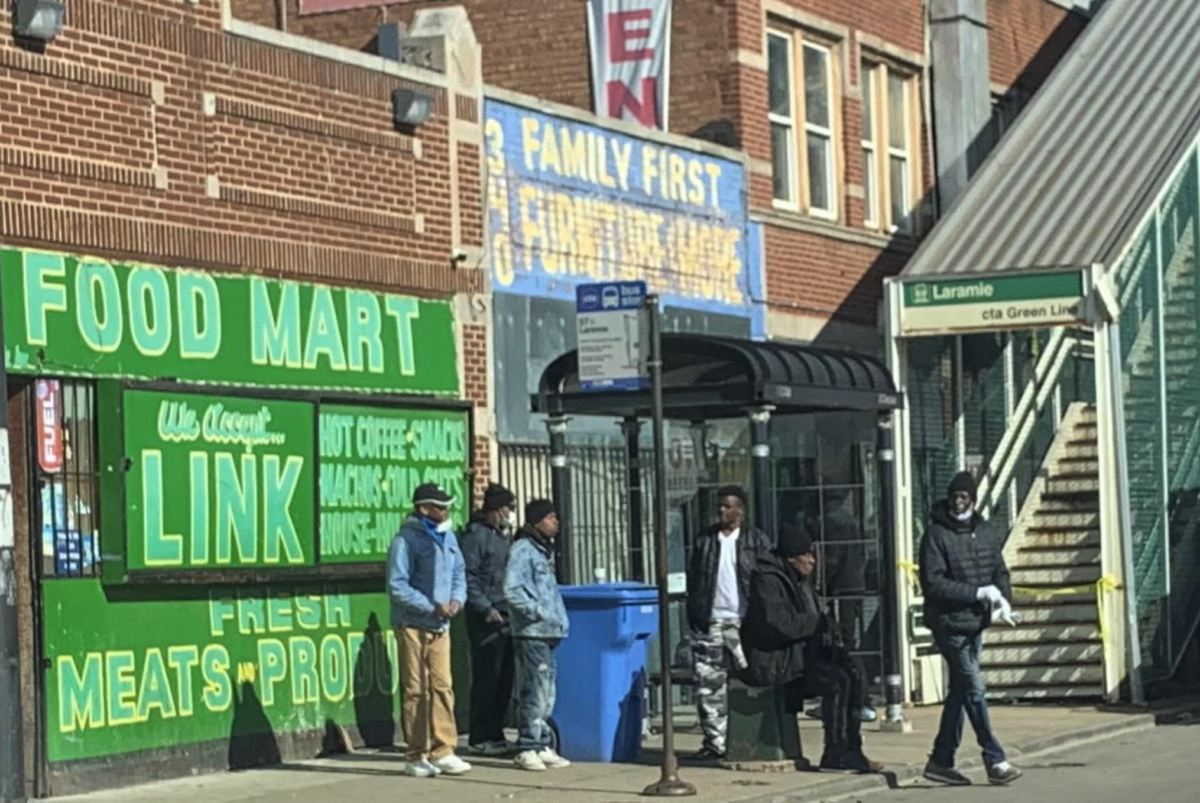
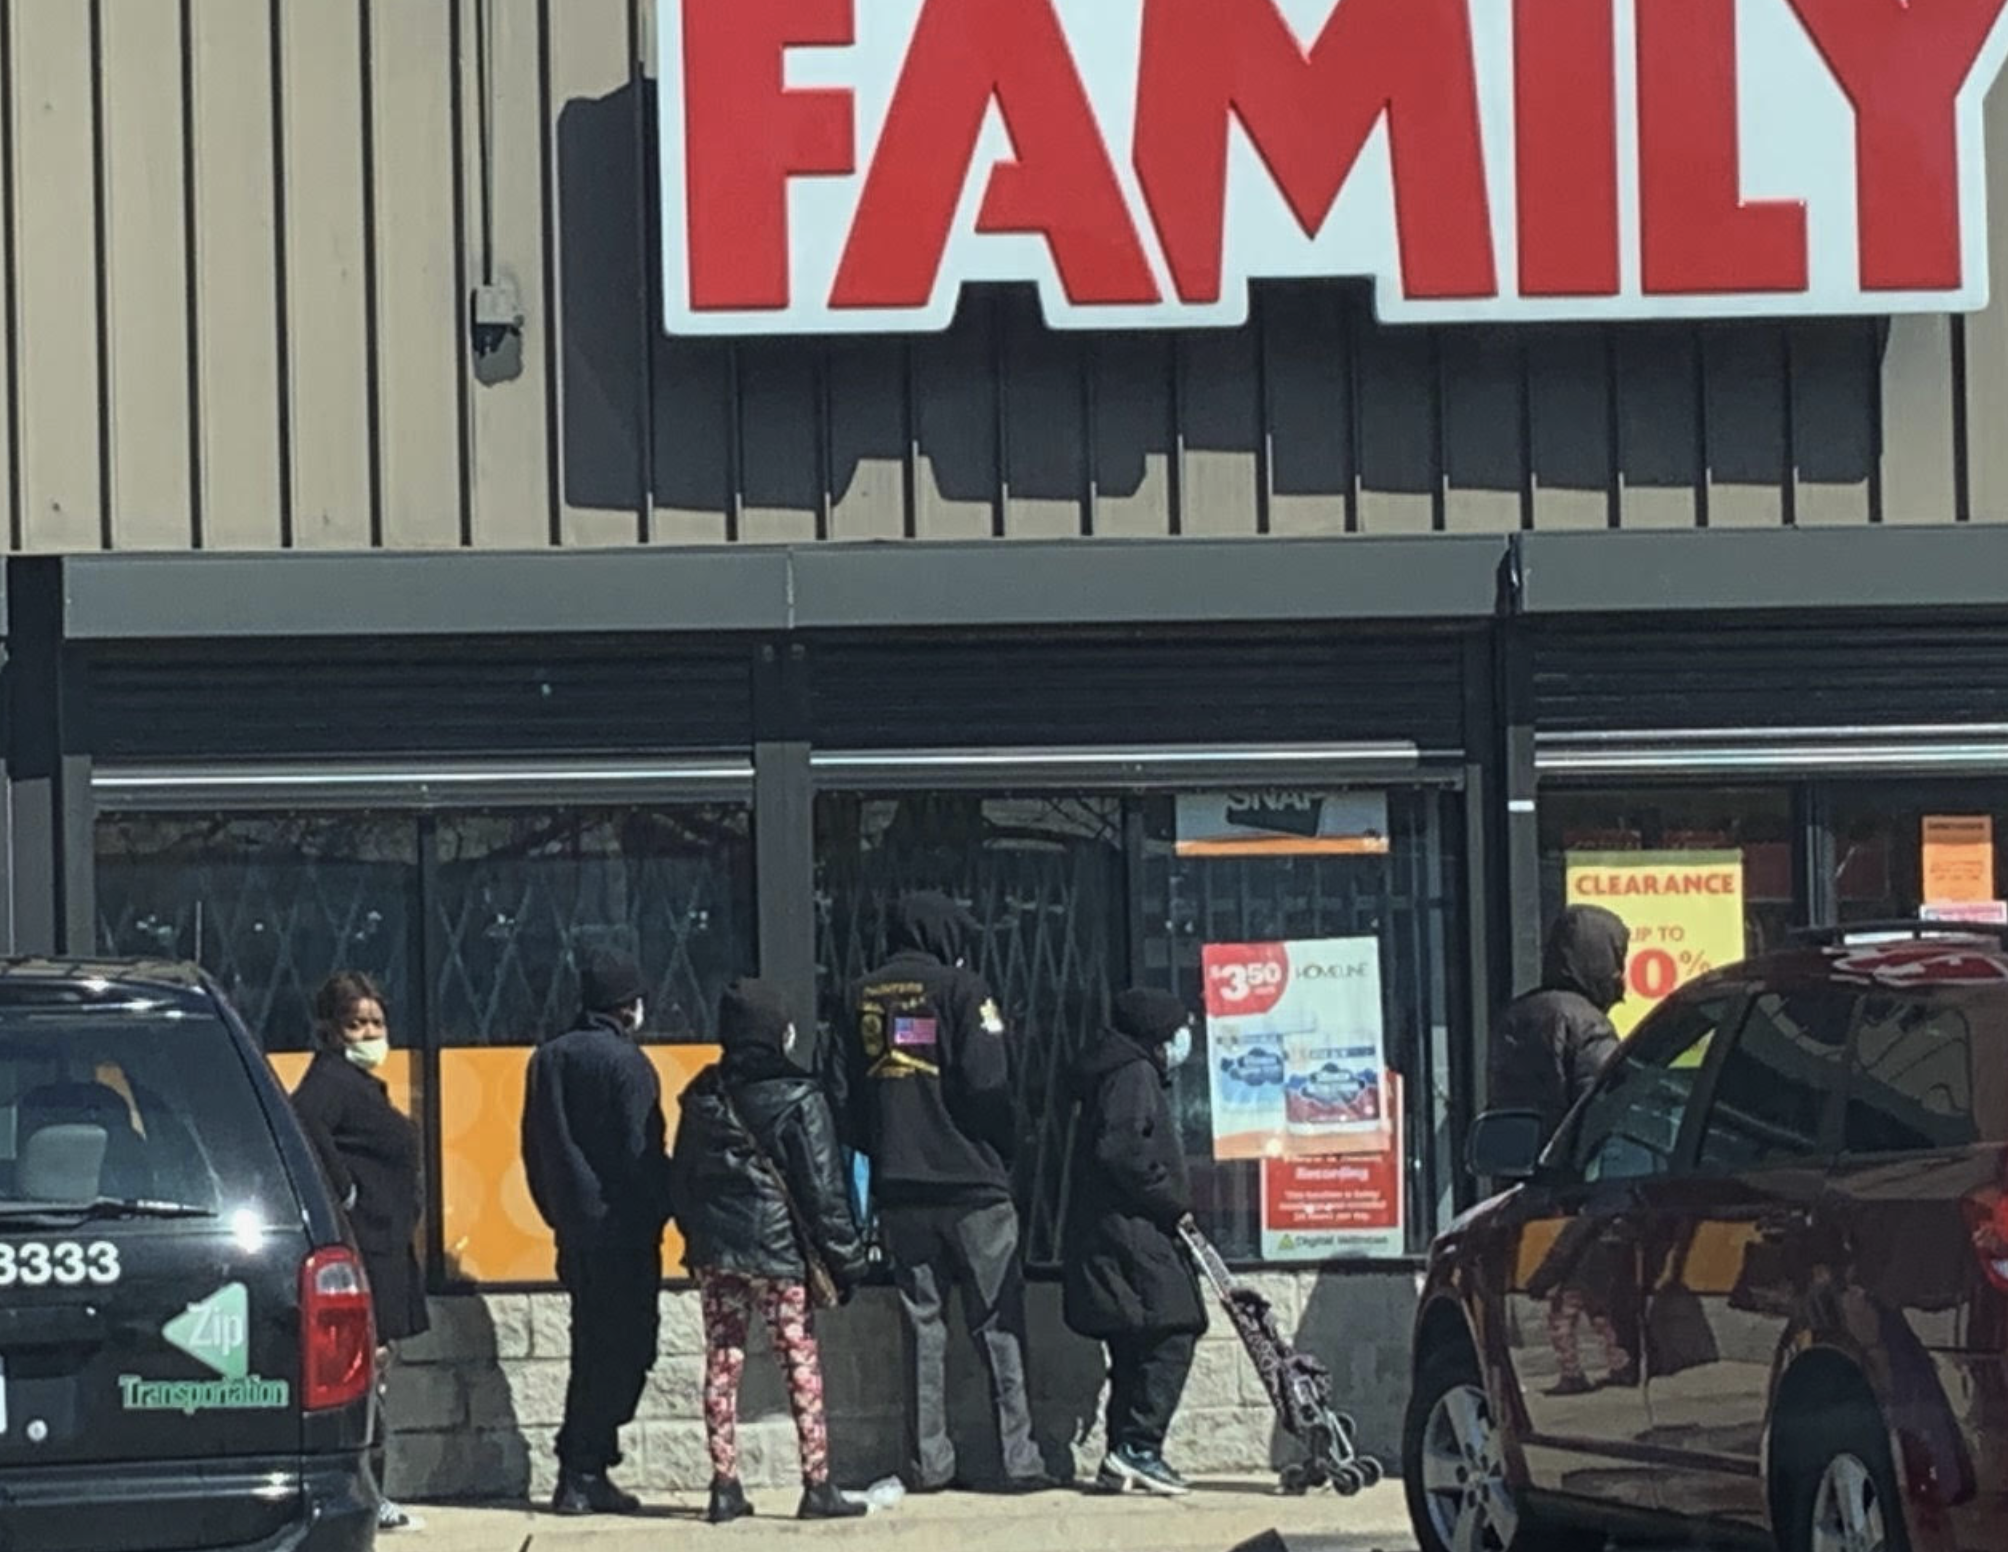
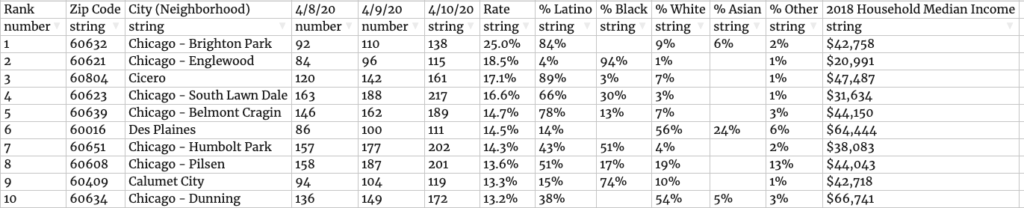
Yesterday I spent time driving into some of the Zip Codes that were experiencing the greatest growth rates that reported 100 or more Coronavirus confirmed positive tests. I observed a lack of social distancing with many young African American men not practicing social distancing or wearing protective masks or gloves congregating outside various essential businesses like retail stores and liquor stores. I observed an instance amongst young male Latinos as well. I observed problems at shopping centers with essential staff not having protective clothing or enforcing social distancing at the entrances or inside their stores. Customers entering stores generally are not wearing protective wraps around their faces.
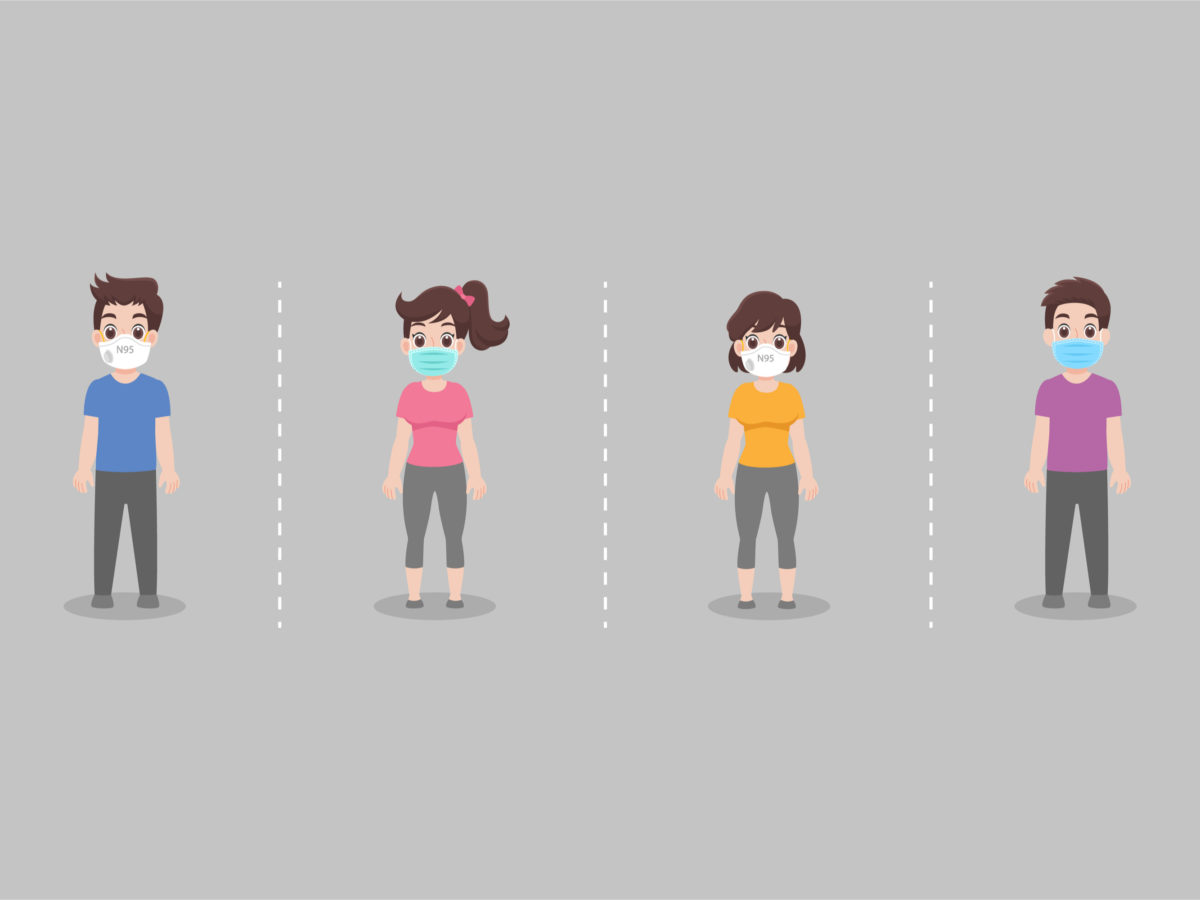
It appears that these locations are economically disadvantaged largely. The residents of these zip codes need help in being educated on prevention measures to curtail the expanding growth rates of the Coronavirus. Businesses operating may need government inspectors to enforce social distancing recommendations through outreach. Ticketing of individuals willfully disregarding social distancing measures in larger groups may be necessary. The State of Illinois should prioritize deployment of the new Rapid 5 minute test equipment to suspected Coronavirus patients in these zip codes to more effectively curtail the growth of the virus to the general surrounding population. Essential service workers need to be wearing protective covering of some sort to help minimize and slow the virus transmission. A ban on shopping to customers not wearing protective coverings may need to be considered in the highest growth areas to protect those residents.
Click the Excel button below to copy the data above into a sortable spreadsheet.
Enigma Forensics President Lee Neubecker wonders why politicians are not following the same CDC directives that we have to. Lee interviews Geary Sikich, President of Logical Management Systems. What are your thoughts? Check out this video interview.
The Transcript of the Video Follows.
Lee Neubecker (LN): This is going to be a short segment about why Congress, Senate, the President, why they’re not practicing, even the governor, why they’re not practicing the recommendations to keep separation and they’re doing these press conferences full of people putting everyone at risk when they can use tools like Zoom and still have the communication but not have the personal interaction. I mean, the Senate’s likely going to all have this thing soon and because they have to vote in person, that’s going to be a real problem if they can’t get something passed and they’re all sick.
Geary Sikich (GS): Yeah, you know, they broached that yesterday during one of their news conferences and Trump was saying that he would like to see them be able to operate remotely but he was saying that it might be a constitutional issue where that may preclude them. They may actually have to show up.
LN: But maybe they could debate everything on a tool like-
GS: Yeah.
LN: Zoom or WebEx and then come in to cast their vote one at a time in isolation so that they’re not around each other.
GS: Yeah, I think that’s … They should be investigating a lot of different options, but they’re not
LN: Why is the president standing next to his advisors, you know, within a foot of them. You have the vice president, the president. They’re all standing next to each other. They should be … The need to have everyone crammed into the White House briefing room, they could be using technology and spacing out so that people aren’t on top of one another.
GS: Yeah, I mean, even if you noticed the media on TV, when you’re watching the news and whatnot, like-
LN: So they have one blank seat. But that’s not six feet away.
GS: No, but I’m saying the media on TV has got separation, like this morning I’m watching NBC on morning news, and they’ve got them sitting. You know, it’s just a wider angle for the camera, and it wouldn’t be that difficult because I’ve noticed the same thing in every press briefing I see, whether it’s the president or the governors, or any of them. There is a kind of a cluster of people around them, which is typical of the way it used to be and it’s not advisable now.
LN: Yeah, but it’s certainly something that should be looked at. I think it’s important that we do everything we can to keep the infection rate from spiking quickly. We know in Italy, when it spiked the way it was, the death rate goes up to 10%.
GS: Yeah, Italy is, it’s scary because everything they have done, they, unfortunately, got … got into it a bit late because they kept their borders open way too long and they allowed things to kind of transpire that now puts them into, you know, the situation being number two as far as fatalities and as far as case rate. Once they started, and they’ve shut down the entire country, now they’re actually shutting down the transportation systems within the country to try to contain this.
LN: It’s something else. And then with spring break, all the students coming back from Florida, California. They’re all at the beaches. This is going to transfer, and they’re going to be bringing their family members a special gift home.
GS: Yeah, it scares me about the fact that we allowed the spring break festivities to go on the way they did, that the governors weren’t a little bit more proactive in that regard, and that the people themselves… Granted, you’re young, you feel like you’re invincible. But the reality is, you’re not. And the once-in-a-lifetime spring break is not all that great as it is. Having not gone to any spring breaks when I was in school, other than the trip out West and whatnot, but … the value of it is far offset by the jeopardy you put yourself in from a health standpoint.
LN: Yeah, absolutely. Well, thanks for coming on the show again to talk about this.
GS: Great, enjoyed it. Well, I’m sure we’ll see each other again virtually.
President and CEO of Enigma Forensics, Lee Neubecker remotely converses with Geary Sikich, President of Logical Management Systems, to discuss the current state of impacts the Coronavirus has brought to citizens taking shelter at home. Data experts Lee and Geary explain statistics state by state and expose interesting facts for those states that have implemented shelter at home policies.
The Transcript of the Video Follows.
Lee Neubecker: I am here today, again with Geary Sikich, reporting from my basement. Geary is the principal of logical management systems. I am the president of Enigma Forensics. We’ve been talking on our show previously about the Coronavirus and the impact. And today we’re going to be talking a little bit about the current data trends and what’s happening. Geary thanks for being on the show remotely.
Geary Sikich: Thanks Lee it’s kind of an interesting way to work.
LN: It’s the new reality probably for a while, huh?
GS: I think for, yes, a little bit more than two weeks that’s for sure.
LN: Yeah, so I want to pull up some of the data that we were talking about earlier. A spreadsheet that we had here. Is that up on the screen for ya?
GS: Yes.
LN: Okay, great. So it’s showing that, this is data that was obtained from the John Hopkins website. They’ve got a place where you can download the historical data. Which I showed you a little earlier. Let me just pull that up. So what you see here, you can go on the map tool. You can actually scroll by clicking on the tab. Internet’s running a little slow. We discussed that previously.
GS: Welcome to the world of not enough pipe.
LN: Yeah so you might not have noticed it but there’s a little section that says admin one. If you hit the right arrows you can scroll through and cycle through and see the data reported differently. First it’s by country, and we’re now at 41,708 in the US. When you click, you can see the total. It’s running very slow today.
GS: Yeah John Hopkins, I know that one of the issues with their website is so many people are using it. That it, by this time of day it starts to slow down a bit. So it’s kind of a challenge to get in there and see the data as it stands. But I just noticed on the statistics for today, that the US stats at noon, when I checked I was doing a webinar today on hospital pandemic planning and drills. And US infection rate has jumped up pretty substantially.
LN: Yeah I want to show you some specifics of concerns as we drill down. I pulled the top 10 states And you can click here, you can see by states and regions. You can see New York is getting devastated right now. Then Washington, and then Cook County Illinois here is running right up next in line. But what I found interesting is as you pull the historical data out, but you can get off, we can see, here is New York. That’s a pretty scary curve, and it’s a trajectory that doesn’t suggest it’s going to get any better any time soon. And then you have Illinois, New Jersey, and what not. But what was real interesting is we had a cross. Illinois is this line right here on the screen there. Illinois is, where is Illinois here. We got, actually what I did is I pulled out New York so I could get more zoned. So excluding New York, you can now see what’s going on. And Michigan, that didn’t have a band until they just announced today that they’re instituting a lockdown. But Illinois, more dense, more likely to get a contagious outbreak than Michigan in my opinion. Because they quarantined early enough, you start to see that at least so far Illinois holding out. Now I think that number’s going to jump up. I think that the number, they haven’t fully reported the count for today yet. But it was interesting to see both Louisiana and Michigan and Florida jump up and surpass. And right now, Florida doesn’t have a ban in place. Georgia doesn’t have a ban in place. What do you think’s going to happen with Georgia?
GS: Well I think what your statistics are showing, and it’s interesting is that the early adopters of shelter in place and working remotely, etcetera, cut the bands, if you will. The early adopters of that are finding that social distancing is actually working. The late adopters who have yet to come to the point of doing shelter in place and what not are finding much like the parallel with Philadelphia and Denver during the Spanish Influenza, Denver closed the city very quickly, very little in terms of issues that they had. Philadelphia on the other hand kept everything open and actually did a parade to try to raise money for bombs for World War One. And as a result they had a significantly higher infection rate. And so I think you’re seeing a parallel in terms of history and what’s happening today. So I would say that those states that are late adopters are probably going to see a higher rate of infection. The other thing it would be, is if we can, you’d have to do some manipulation on data with this but is to look at those states which have large cities. Chicago, New York City, Los Angeles. Some of the bigger cities are going to have a significantly bigger concentration of casualties, if you will. That is going to result, it results from the fact that people are living in close proximity in those cities. The other aspect is that, if you think about it, a lot of downtown populations don’t have the, how do I put it, the infrastructure to do a lot of at home cooking. So it’s either they don’t have the storage facilities for food or they just don’t cook because restaurants are so plentiful. And suddenly we’re finding that with restaurants closed and other things being shut down, as far as businesses and what not, that there’s a greater dependence for people to be a little bit more self-sufficient, if you will.
LN: Yep, it’s certainly going to get interesting here. Well, thanks for coming on the show again and talking about this. I’m sure we’ll have some more things to talk about again soon.