COVID-19 Impact on Supply Chain

Was the COVID-19 Pandemic a wake up call for those businesses who are dependant on the world’s supply chain? Let’s face it everyone is dependent in one way or another on the world’s supply chain. But do we really understand what’s going on? Check out this video blog as experts take a look at the supply chain and the impact of COVID-19.

What’s going on with the world’s supply chain?

Enigma Forensics is wondering about the impact the Coronavirus/COVID-19 pandemic has had on the world’s supply chain. Lee Neubecker sits down (virtually) with Geary Sikich from Logical Management Systems. Both agree the spread of Coronavirus/COVID-19 has been a wake-up call for the world.

First of all, we think it’s safe to say everyone is feeling the impact of COVID-19! It has been devastating for every human being on the planet. What have we learned? Supply chains that carry life-saving products were pinched off and that presented a huge shortage sending the medical professionals and government agencies scrambling to provide much-needed protective medical supplies. Many businesses are dependent on global sourcing and have now found themselves facing hard choices amid the supply chain disruptions.

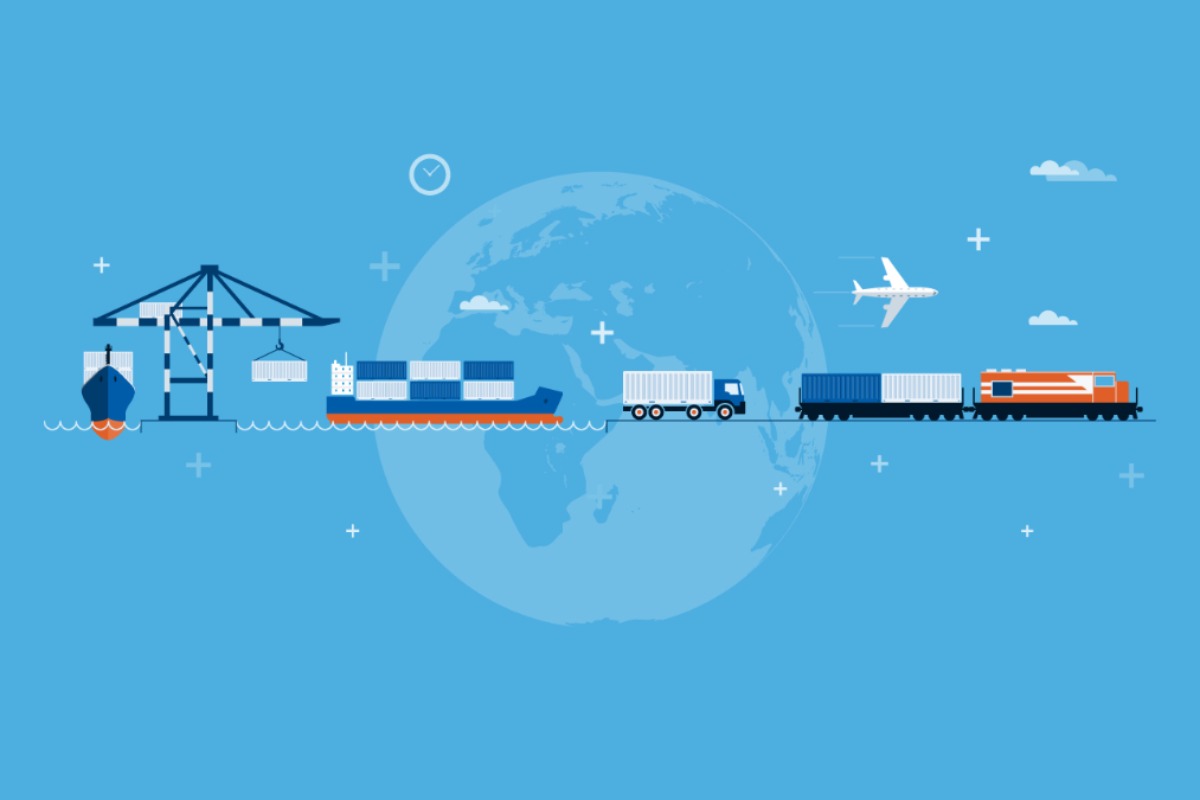
Both Lee and Geary, agree shipping is an under-reported issue that has been negatively impacted by COVID-19. We all know the story of stranded cruise ships that were quarantined at sea and as a result cruise ships became super-spreaders of the virus. But, what about the shipping industry? Specifically, cargo, oil tankers, and container ships. We know these types of goods transports have limited crews, to begin with, and now we have learned that some of these ships have been quarantined at sea. If they make it into port they are quarantined based on the fact the products they are transporting could possibly be infected. Check out this video to learn more about the COVID-19 impact on the supply chain.

Was COVID-19 pandemic a wake up call?

Lee Neubecker (LN): I am here today with who is that? Geary Sikich, you wore your mask.

Geary Sikich (GS): Yes I’ve been completely protected with this mask.

LN: Is that comfortable?

GS: No, it’s hot and it is made out of rubber. So it’s to kind of a, not the greatest mask in the world if you choose to wear one but it’s good for comedy and it’s almost Halloween so.

LN: So how much did that set you back?

GS: $10 on Amazon

LN: Now how’s the breathability of that thing?

GS: Actually the breathability is pretty good. It actually is pretty good. Then, the biggest issue you face with it is just that you’re going to have body heat kind of contained. If you don’t wear it for a long period of time or you don’t have headphones on you should be okay.

LN: So I had you on the show today. I wanted to ask you some questions about what impact the COVID-19 pandemic is having on our trade environment with imports and exports.

GS: So in general, as the pandemic started to evolve, we saw the impact in a number of different areas. There was a lot of impact on the cessation of imports by countries China, for example, ceased and used force measures to stop oil shipments from coming in. The US has had a big backlog on all their ports, because of concern over making sure that what’s coming into the country is not tainted. The bigger impact and this was one that really is kind of been under-reported if you will, has been that the shipping industry., now take cruise lines out of it ’cause they got a tremendous amount of media coverage with cases there. But what we have is a real issue with shipping, the ships that are container ships, bulk ships, cargo ships of all types, including your large oil carriers. There is a limitation of people who serve on those ships, crews. There’s been a lot of crews that because of Coronavirus/COVID-19 infection on a ship have been quarantined out at sea. And so we’re seeing ships being taken off usage because they’re sitting being quarantined. We’re seeing so a disruption in the supply chain because of a key component of the supply chain, not related to the end products or the originating product.

LN: So all the just in time delivery and assembly is really a parenting problem we say can’t rely on the GPS and calculated travel time.

GS: And actually there’s been another issue that’s come up with, with the systems on ships because of cybersecurity obviously, and in a general way, but they’ve had a tremendous impact in those areas because of that. So shipping has been hit majorly as has air transport because airlines have cut back so tremendously on flights.

LN: All right so in terms of some of the supply chain security programs they have out there, what are you seeing that companies are doing to protect their supply chain implementing these programs?

GS: A lot of what I see right now is that companies are trying to find alternative suppliers so that they can have a broader base of supply chain. So from where we were single-source supply, we’re now looking at moving towards multiple source supply so that they can continually keep a feed of supply coming in.

LN: Yeah because I’d imagine if certain regions experienced the COVID-19 outbreak more, that would disrupt the supply either going to or coming from that region.

GS: Yeah, and you think about things like border closures, you think about things like the inspection process, the concern over whether or not there is going to be contamination coming in in a cargo container you know, may have.

LN: Are they having, in some cases are they having the ships quarantined when they arrive?

GS: In a lot of cases

LN: Before they are unloaded?

GS: Yeah and that impacts tremendously because you got to take a look at the shipping industry and the cargo shipping. They have gone from smaller cargo ships to mega cargo ships. And these mega cargo ships can have, you know, a lot of containers, hundreds of containers if not more. And the problem is when you lock in a ship like that, your shipment may be one of many that gets stuck. And when you take that size ship out of service you can’t replace it very quickly because what happens in the industry is very simple. They’ve gone to larger ships to carry greater amounts. So economy of scale, and they’ve taken the smaller ships and as is now the case with the cruise industry they’re in yards in India and various other countries and shipbreaking yards. So they’re completely being taken apart and they’re no longer part of the service of shipping that’s out there. Now so replenishment of the container, the vessel, is going to have an impact. And if you take one out, you don’t have an easy replacement for it.

LN: Geary well, thanks a bunch for being on the show. I really appreciate it.

GS: Thank you Lee I appreciate your time.

To Learn More About Logistical Management Check out this website

http://logicalmanagement.com/

COVID-19 Account for 60% of Latino Neighborhoods

In early April, Latino communities in Chicago experienced a fast growing number of COVIS-10 Cases.

As of 4/14/20, the Top Fastest growing Illinois Zip Codes reporting new COVID-19 cases shifted disproportionately to Latino populations based on the ethnic racial makeup of those Zip Codes. The CDC needs to immediately begin releasing detailed data on actual confirmed Coronavirus positive cases and deaths by Zip Code to help effectively target emerging hot pockets. There remains no available data reporting death’s by zip code impacting the Latino community.

Of the 710,648 people that live in the top 10 Zip Codes (2014 Census estimates from https://zipdatamaps.com/), the racial break down of these combined communities is as follows:

Racial Group2014 Population% of Population
White159,87022%
Black or African American76,32311%
Hispanic / Latino428,16960%
All Others46,2867%
All Groups Top 10 Zip Codes710,648
Source data Illinois Department of Public Health compiled daily by Enigma Forensics to report 2 day trailing growth rates of the virus.

This new data suggests that Mayor Lightfoot’s campaign targeting African American and other communities has been highly effective at slowing growth rates in many majority African American and other neighborhoods where English is broadly spoken. The growth rates in majority Latino neighborhoods suggests similar outreach efforts and analysis is needed targeting Latino neighborhoods where the virus is growing at the highest rates across Illinois.

Yesterday, a coalition of Latino leaders issued a press release calling on such a well needed outreach campaign to address the unique cultural and language needs of the Latino communities.

Other observed trends from yesterday’s data is the emergence of University Village into the top position for fastest growing Zip Code statewide at an alarming rate of 27% daily growth over the most recent 2 day period. We speculate that this may be a result of UIC and possibly the increase in availability of rapid testing in that zip code.

[visualizer id=”7708″]

Top 10 Coronavirus Confirmed Positive Growth Zip Codes in Illinois

The following data was compiled using the Illinois Department of Public Health’s daily statistics showing Coronavirus / COVID-19 Confirmed Positive Statistics taken from each of the last three day reports. The ranking is based on the 2 day average daily growth rate. Demographic data has been added from the website illinois-demographics.com to help better understand the communities impacted. The data shows statistics reported as of April 10th, 2020.

Yesterday I spent time driving into some of the Zip Codes that were experiencing the greatest growth rates that reported 100 or more Coronavirus confirmed positive tests. I observed a lack of social distancing with many young African American men not practicing social distancing or wearing protective masks or gloves congregating outside various essential businesses like retail stores and liquor stores. I observed an instance amongst young male Latinos as well. I observed problems at shopping centers with essential staff not having protective clothing or enforcing social distancing at the entrances or inside their stores. Customers entering stores generally are not wearing protective wraps around their faces.

It appears that these locations are economically disadvantaged largely. The residents of these zip codes need help in being educated on prevention measures to curtail the expanding growth rates of the Coronavirus. Businesses operating may need government inspectors to enforce social distancing recommendations through outreach. Ticketing of individuals willfully disregarding social distancing measures in larger groups may be necessary. The State of Illinois should prioritize deployment of the new Rapid 5 minute test equipment to suspected Coronavirus patients in these zip codes to more effectively curtail the growth of the virus to the general surrounding population. Essential service workers need to be wearing protective covering of some sort to help minimize and slow the virus transmission. A ban on shopping to customers not wearing protective coverings may need to be considered in the highest growth areas to protect those residents.

Click the Excel button below to copy the data above into a sortable spreadsheet.

[visualizer id=”7568″]

View all Illinois Zip Codes with 100 or more Coronavirus Confirmed Positive Cases ranked from fastest growing to slowest growing.

Top 10 Illinois Zip Codes with Largest Confirmed Corona Positive Cases

The Illinois Department of Public Health has begun publishing zip code level Coronavirus / COVID-19 Confirmed Positive cases. This data was captured as of 4/8/2020 4:15PM from http://www.dph.illinois.gov/covid19/covid19-statistics

The top 10 Zip Codes in Illinois reporting the highest number of Coronavirus / COVID-19 Confirmed Positive Cases

Top Cook County Locations Where Coronavirus / COVID-19 Confirmed Cases have been reported.
Zip CodePositive CasesCity – Neighborhood – CountyPeople per sq mile% of Population in Zip Code Black
60645272Chicago – West Ridge – (Cook)20,05514%
60620269Chicago – Auburn Gresham – (Cook)10,19198%
60619238Chicago – Chatham – (Cook)10,60197%
60628229Chicago – Roseland – (Cook)6,61295%
60617209South Chicago – (Cook)6,07056%
60644184Chicago – Austin – (Cook)13,88594%
60085178Waukegan – (Lake)4,79119%
60643178Beverly – (Cook)6,80075%
60623163Chicago – South Lawndale (Cook)17,19633%
60629162Chicago – Chicago Lawn (Cook)16,72623%
Six out of the top ten zip codes in Illinois with the highest total confirmed Coronavirus confirmed positive cases are majority black / African American population centers. Income, population, density and race appear to be factors in test positive rates. Incarceration rates by zip code we plan to look into as well to see if there appears to be a correlation. African Americans make up a disproportionate part of the prison population. This seems to be impacting them at a much higher rate.

Waukegan may be higher due to it being home to Abbott Laboratories which recently reported availability of Coronavirus rapid 5 minute test units.

Social Distancing Photos in Hot Zones

60644 Chicago Austin Photo Taken @ 4/9/20 9:30AM

60628 Chicago 100 W. 95th @ 4/9/20 10:30AM

60620, Family Dollar, 7927 S Ashland Ave, Chicago, IL 60620 @ 4/9:20 10:30AM

60620 Home Depot taking appropriate measures 200-232 W 87th St Chicago, IL 60620

State Ranking Coronavirus / COVID-19 Zip Codes reporting more than 5 Confirmed Positives as of 4/9/20

State RankingZip Code4/8/204/9/20Net Change
1606202692928.6%
2606452722854.8%
36061923826511.3%
4606282292383.9%
5606172092268.1%
66064418420410.9%
76008517819610.1%
8606431781927.9%
96062316318815.3%
106060815818718.4%
116062916218111.7%
126065115717712.7%
136061215617612.8%
146062415117113.2%
15604111581686.3%
166063914616211.0%
176064914716210.2%
18606341361499.6%
19606181351425.2%
206080412014218.3%
21606371241369.7%
22606591321341.5%
23606251281333.9%
246063611713011.1%
256061411412913.2%
26606571201243.3%
27604021151237.0%
286062211012311.8%
296046611012210.9%
30606521161214.3%
316065310811910.2%
326060910311410.7%
33606131071146.5%
34604431011119.9%
35606329211019.6%
36606151091090.0%
3760638991089.1%
38606401011075.9%
39606169210615.2%
40604099410410.6%
4160076961026.3%
4260435981024.1%
4360025971014.1%
4460104921019.8%
45600168610016.3%
4660901921008.7%
476062694984.3%
486045388969.1%
4960621849614.3%
5060473839413.3%
516064788935.7%
526052786904.7%
536007781888.6%
5460440788610.3%
556082782864.9%
566041978859.0%
576063080845.0%
586064176816.6%
596061078802.6%
606020177770.0%
6160655667716.7%
626003576760.0%
6360153657616.9%
646070774762.7%
656007374751.4%
666060770757.1%
6760426657413.8%
686047868748.8%
6960099637112.7%
706043866717.6%
716009369701.4%
726006862689.7%
736066063664.8%
7460087536522.6%
7560101546316.7%
76604296563-3.1%
7760586556314.5%
786006258615.2%
7960506526117.3%
806009160600.0%
816020258603.4%
8260446495920.4%
836061158591.7%
846063155597.3%
856047155585.5%
866004556571.8%
876006456571.8%
886043054575.6%
896071452567.7%
9060148495512.2%
9160406505510.0%
926015451545.9%
936044151545.9%
946001552531.9%
9560302465213.0%
9660462425121.4%
976005649502.0%
986064648504.2%
996018847494.3%
1006042345498.9%
1016042845498.9%
10260656424916.7%
1036060546484.3%
1046009045474.4%
1056016044464.5%
1066005343454.7%
1076045542457.1%
1086008941447.3%
10960431404410.0%
1106049042444.8%
11160026394310.3%
1126003142432.4%
11360133374316.2%
11460459384313.2%
11560525364319.4%
11660805384313.2%
1176001840425.0%
1186043341422.4%
1196010639415.1%
1206012037408.1%
1216012338405.3%
1226012637408.1%
1236013937408.1%
1246018540400.0%
1256040339402.6%
1266065439402.6%
12760107333918.2%
1286013036398.3%
1296013137395.4%
1306018138392.6%
13160477353911.4%
1326042536385.6%
1336045235388.6%
13460565303826.7%
1356071237382.7%
13660505293727.6%
13760164283628.6%
1386019335362.9%
13960484313616.1%
14060706313616.1%
1416004633356.1%
1426007432359.4%
1436042232359.4%
1446056132359.4%
1456041731349.7%
1466049131349.7%
1476051732346.3%
14860004303310.0%
14960048303310.0%
15060463283317.9%
15160467293313.8%
1526056432333.1%
15360007293210.3%
15460098273218.5%
15560432283110.7%
15660475283110.7%
1576006028307.1%
1586054329303.4%
1596060128307.1%
16060047262911.5%
16160439242920.8%
1626013728280.0%
1636045126287.7%
1646050427283.7%
16560516232821.7%
16660544252812.0%
1676055927283.7%
16860563252812.0%
1696044525278.0%
1706046525278.0%
1716048725278.0%
1726001424268.3%
1736016225264.0%
1746040425264.0%
1756041524268.3%
1766064225264.0%
1776170125264.0%
17860061222513.6%
1796010223258.7%
1806010324254.2%
1816051325250.0%
1826124423258.7%
18360044212414.3%
1846015523244.3%
18560436212414.3%
18660448212414.3%
1876063322249.1%
18860803212414.3%
1896003022234.5%
1906017222234.5%
1916046123230.0%
19260585202315.0%
1936001321224.8%
19460084192215.8%
1956054622220.0%
1966091422220.0%
197628010222200.0%
19860005172123.5%
19960010192110.5%
20060108192110.5%
2016018920215.0%
20261265172123.5%
20360050162025.0%
2046017119205.3%
20560194182011.1%
2066052119205.3%
2076256820200.0%
20862901162025.0%
2096017519190.0%
2106040118195.6%
2116044918195.6%
2126045719190.0%
21360515171911.8%
21460540171911.8%
21562040171911.8%
21660008161812.5%
2176043417185.9%
21860472161812.5%
2196051417185.9%
2206182217185.9%
22162226141828.6%
22262233141828.6%
22362236718157.1%
2246005116176.3%
2256006717170.0%
226601691817-5.6%
2276030416176.3%
2286052317170.0%
2296120117170.0%
2306011516160.0%
23160418141614.3%
23260502131623.1%
2336053216160.0%
2346066116160.0%
2356176116160.0%
2366222116160.0%
23762269141614.3%
2386000214157.1%
23960156131515.4%
2406044214157.1%
2416229814157.1%
2426008313147.7%
24360110101440.0%
2446017414140.0%
24561704121416.7%
24662002121416.7%
24762223111427.3%
2486002213130.0%
2496013413130.0%
250601421413-7.1%
2516017613130.0%
252602031413-7.1%
2536052612138.3%
2546004312120.0%
2556016581250.0%
25660458101220.0%
25760501101220.0%
2586056012120.0%
2596108112120.0%
2606202511129.1%
2616220811129.1%
26260012101110.0%
2636006911110.0%
26460081101110.0%
2656012411110.0%
2666054291122.2%
2676060611110.0%
2686002010100.0%
2696014010100.0%
2706017710100.0%
2716030591011.1%
2726046491011.1%
2736048281025.0%
2746050310100.0%
2756053871042.9%
2766095081025.0%
2776110271042.9%
2786180110100.0%
2796182110100.0%
2806220691011.1%
281622341110-9.1%
2826270281025.0%
28360070990.0%
28460118990.0%
28560163990.0%
286604698912.5%
287605347928.6%
28860558990.0%
28961802990.0%
290626508912.5%
29160136880.0%
292601737814.3%
29360178880.0%
29460301880.0%
29560410880.0%
296604507814.3%
29762278880.0%
2986230508800.0%
29960042770.0%
30060191770.0%
30160192770.0%
30260468770.0%
30360510770.0%
30460545770.0%
30560554770.0%
306609646716.7%
307611096716.7%
30861241770.0%
3096176407700.0%
31062220770.0%
31162258770.0%
31262265770.0%
3136230107700.0%
31462711770.0%
3156011906600.0%
31660143660.0%
31760187660.0%
31860551660.0%
31960555660.0%
3206103206600.0%
3216110306600.0%
32261114660.0%
32361282660.0%
32461853660.0%
32561910660.0%
3266203406600.0%
32762035660.0%
32862959660.0%
329600416 -100.0%
330620956 -100.0%

Top Counties That Should Consider Lockdown!

Chicago’s Enigma Forensics Data Analytic and Cyber Security Expert Lee Neubecker has identified top counties in the country that should consider going on lock down because of the alarming climbing numbers. Some of these counties may not know they are approaching a dangerous risky situation. Lee has been taking a deeper dive on the most recent Coronavirus stats identifying the most at risk counties. Lee was way ahead of CNBC’s report that President Trump has called for classifying Coronavirus risk county by county!

Check out this video to see if your County is on his list!

Video Transcripts Follows

The Transcripts go here!

Top Locations in U.S. Where Corona Deaths Are Ramping

These are locations that report 3 or more Corona Related Deaths. Only 1 of these 28 locations has their Daily Growth rate under 30%. Medical supplies are desperately needed at these locations.

Average Daily Growth Rate= ((3/27 Confirmed Cases – 3/23 Confirmed Cases)/(3/23 Confirmed Cases))/Days Elapsed

Estimated Confirmed Positive Cases One Week Out = 3/27 Confirmed Cases * (1 + Average Daily Growth Rate)* (1 + Average Daily Growth Rate)* (1 + Average Daily Growth Rate)* (1 + Average Daily Growth Rate)* (1 + Average Daily Growth Rate)* (1 + Average Daily Growth Rate)* (1 + Average Daily Growth Rate)

Note: The average daily growth rate will slow before exceeding the max population. E.G. IN-Marion will not continue at the experienced average 245% daily growth rate.

The Transcript of the Video Follows:

Kitty Kurth (KK): Good morning! Today we’re here with Lee Neubecker from Enigma Forensics. A renowned data analyst, computer forensics expert, and inquisitive mind. Lee’s been thinking about the corona virus and looking into data. The data that’s out there in the world and taking it in, and looking at how we can analyze this data and what we can learn from it. Lee, tell us about what you’ve been doing.

Lee Neubecker (LN): Yes well, like everyone else I’ve been holed up at home in my basement and I’ve been wanting to think about, what can I do to help impact positive change, and what can my team do. And we decided we wanted to use our time to help minimize the spread of the virus and to help minimize death, so that’s my new mission that gives me something to wake up for and do, because certainly in the short term most client work is on hold because the courts are closed.

KK: So what, yesterday you released some data, can you tell us about where you got the data, what it was, and what it means. What you did with it, what it means.

LN: Yes, well like everyone else, I’ve been looking at the John Hopkins data map and they have a really nice visualization tool that lets you see the data as it’s updated. And I was examining their site and I discovered they had a GitHub repository where they’re uploading every day around 7pm central time. And as I looked at the data, I thought, you know there’s some interesting things that probably could be done that aren’t happening yet, such as looking at the penetration rate. If the county data just became available of the reporting, I looked out at the census and found some data from the census that included the population by county. So I started mapping out the population by county so that I could come up with something that I’m calling penetration rate. Which is essentially, what percent of the population has tested positive for the virus. And that information’s useful because it can give us some idea of, you know, how saturated will things be. Unfortunately though, the testing kits aren’t widely available so, it’s difficult to know for certain what’s happening as it relates to testing. More telling though is the data relating to deaths of corona virus, and that’s something that I was looking at this morning. And it has some, you know, really interesting things to talk about.

KK: What did you find when you were looking at that data? And the data you released yesterday, didn’t it show that there are 10 counties that are particularly in dire straits, or will be in dire straits, where the county officials should telling everybody to stay home.

LN: Yeah here’s my data model, are you able to see that? On screen, great. So, what I did is I thought, let’s look at locations that have 10 or more positive tests, and have, what are top 10 locations with 10 or more positive tests, that have the greatest rate of daily growth. And those are areas that no one’s talking about right now but I thought it was important to talk about that because they may think they’re safe. They may not know that someone’s begun passing the virus in the community. And so, you know, I identified places like Jackson, Michigan, which isn’t too far from where my family members are. They may not know there that they have a problem. They may not have public health professionals like Cook County has, dedicated to looking at the data. So, I thought it was important that we get the word out to some of these communities, that they’re emerging very fast with their growth of corona positive tests.

KK: There were some new data that you looked at last night, and some new things that you found, what did you find today?

LN: I wanted to look at where are people actually having deaths reported. So I looked at, where are there three or more deaths in the US. And because the tests are less reliable, you know, the confirmed test because there aren’t enough tests out there. But the places where people are actually starting to die, those are the places that are going to need a lot of medical supplies and help. And so today I published a new list of 29 locations. Let me resort this here by death rate. And death rate is a calculation, you know, how many deaths relative to the population. So for instance, in Dougherty, Georgia. They have the highest death rate, which may mean they’re in dire need of medical supplies. But they’re a very low population area.

KK: Georgia is one of the places that nobody’s been talking about at all. LN: Yeah and you can see there that, their population’s 87,000 roughly. They’ve had six deaths, but in terms of death rate, they’re at the top of it. So, you know, the public needs to look at what’s going on there. Are they keeping their kids at home? Are schools still open? Now those are important questions. Are people cavalier about it? You know, what’s the characteristic of the people who passed away? Are they all in a nursing home? There’s a lot of other things that can be looked into here. KK: Is there a cluster, are they all in one place? Or are they people that are out circulating in the community?

LN: Exactly.

KK: Is one of them the letter carrier? And then Louisiana has a high death rate and we heard about the fact that there are numerous cases there. Washington State it looks like is also high. New York, New Jersey. Connecticut is really growing it looks like. But then Colorado, no one has talked about that this one county in Colorado, El Paso County seems to have a really high rate. And Milwaukee, Wisconsin. People aren’t really talking about that either.

LN: If you look at Cook County, Illinois. What this is showing in my opinion is that despite the fact that we have a lot of cases, our health care system is keeping up, and keeping people from dying. So, you know, looking at how LA’s performing, what’s LA getting in terms of resources, and what’s the quality of their health care versus Dougherty, Georgia, or King, Washington, or some of these other places. You know, it’s very disheartening for instance to see Dougherty, Georgia, they’re at a 71% increase in testing over just a few days. That’s a average daily increase. They’ve actually, you know, more than almost tripled in just a few days.

KK: And again, that’s something that at least in the national media, no one is addressing Georgia. So, you know, we don’t know. I hope Georgia realizes they have a problem but no one else has talked about the fact that Georgia has a problem.

LN: The White House did say yesterday, that they wanted to try to address the counties where the hotspots are. So these are the hotspots. Some would say we should be doing this at the state level, and not focusing just on the county. But these counties definitely need attention.

KK: These counties need attention but what I heard the White House also say was, “we’re going to let counties be free if they’re not affected, then they can open up for business again.” And I don’t know about other states but here in Illinois, people go across the Cook County, Lake County, Cook County, DuPage County, Cook County, Will County borders pretty frequently. And sometimes several times in a day. So I don’t see how a plan to let places quote open up for business on a county by county basis could be helpful.

LN: Yeah but, you know, one of the things that I’ll be looking at as I update data. We’ll be looking at what’s going on in these counties. Are they sending alert out to people? If people aren’t aware that they’re having a daily increase of 128%, like Marion, Indiana. Their increase rate is alarming, 128%.

KK: And I don’t know about today, but historically Marion has been a place with a lot of manufacturing, and if people are working side by side in factories, that could be a huge problem. Thank you very much, and we’ll put up another post tomorrow and the next day as more data becomes available. Thank you Lee Neubecker and Enigma Forensics.

LN: Thank you.

Related Posts

Coronavirus COVID-19 Confirmed Diagnosis Count by County – Emerging Risk

These US Counties are experiencing fast growth and have surpassed 10 reported cases. They are ranked by daily growth rate and are growing at an alarming rate.

Enigma Forensics is a Chicago based Computer Forensics, eDiscovery and Cyber Security firm that specializes in performing complex data analytics. In an effort to help inform the public, we have developed a data model to perform more meaningful comparisons of the latest data released and compiled by John Hopkins University to their GitHub Repository. Beginning on March 23rd, 2020, more robust reporting by U.S. County became available. We have matched this data up to population estimates by County obtained from the U.S. Census estimated as of July 1, 2019.

Disclaimer: There remain issues with matching up some of the Counties that use a different naming convention in reporting compared to the naming convention used by the U.S. Census. As such, some Counties reflecting no population will be updated as this data is refined. The latest compilation of data shows the average daily rate of increase in Coronavirus confirmed tests. The top ranked Counties should immediately take action to curtail further rampant growth of the virus.

These U.S. Counties Need to take Prompt Action to Curtail the Spread of Coronavirus COVID-19

Updated 3/26/20 8:41PM to include new data for these 10 Counties released 3/26/20 GMT. See below:

Coronavirus Spread by County
State CountyReport DateConfirmedDaily Growth RateAverage 3 Day Growth
AL-Chambers County23-Mar-202
AL-Chambers County24-Mar-205150.00%
AL-Chambers County25-Mar-2010100.00%
AL-Chambers County26-Mar-201330.00%550.00%
AL-Mobile County23-Mar-202
AL-Mobile County24-Mar-206200.00%
AL-Mobile County25-Mar-201066.67%
AL-Mobile County26-Mar-201880.00%800.00%
KS-Sedgwick County23-Mar-202
KS-Sedgwick County24-Mar-207250.00%
KS-Sedgwick County25-Mar-201157.14%
KS-Sedgwick County26-Mar-201645.45%700.00%
MI-Jackson County23-Mar-201
MI-Jackson County24-Mar-206500.00%
MI-Jackson County25-Mar-2012100.00%
MI-Jackson County26-Mar-201741.67%1600.00%
NY-Broome County23-Mar-203
NY-Broome County24-Mar-209200.00%
NY-Broome County25-Mar-201122.22%
NY-Broome County26-Mar-201645.45%433.33%
NY-Ulster County23-Mar-2018
NY-Ulster County24-Mar-203594.44%
NY-Ulster County25-Mar-206585.71%
NY-Ulster County26-Mar-207820.00%333.33%
TX-Nueces County23-Mar-201
TX-Nueces County24-Mar-206500.00%
TX-Nueces County25-Mar-201066.67%
TX-Nueces County26-Mar-201440.00%1300.00%
WA-Kittitas County23-Mar-204
WA-Kittitas County24-Mar-20525.00%
WA-Kittitas County25-Mar-2018260.00%
WA-Kittitas County26-Mar-208-55.56%100.00%
WV-Monongalia County23-Mar-202
WV-Monongalia County24-Mar-205150.00%
WV-Monongalia County25-Mar-2016220.00%
WV-Monongalia County26-Mar-201812.50%800.00%
PA-Dauphin County23-Mar-201
PA-Dauphin County24-Mar-204300.00%
PA-Dauphin County25-Mar-2010150.00%
PA-Dauphin County26-Mar-201330.00%1200.00%

Click here to view the latest more complete list.

https://www.mlive.com/news/jackson/2020/03/10-hospitalized-in-jackson-county-for-coronavirus.html

Why Don’t Politicians Follow CDC Directives? Coronavirus Social Distancing

Enigma Forensics President Lee Neubecker wonders why politicians are not following the same CDC directives that we have to. Lee interviews Geary Sikich, President of Logical Management Systems. What are your thoughts? Check out this video interview.

The Transcript of the Video Follows.

Lee Neubecker (LN): This is going to be a short segment about why Congress, Senate, the President, why they’re not practicing, even the governor, why they’re not practicing the recommendations to keep separation and they’re doing these press conferences full of people putting everyone at risk when they can use tools like Zoom and still have the communication but not have the personal interaction. I mean, the Senate’s likely going to all have this thing soon and because they have to vote in person, that’s going to be a real problem if they can’t get something passed and they’re all sick.

Geary Sikich (GS): Yeah, you know, they broached that yesterday during one of their news conferences and Trump was saying that he would like to see them be able to operate remotely but he was saying that it might be a constitutional issue where that may preclude them. They may actually have to show up.

LN: But maybe they could debate everything on a tool like-

GS: Yeah.

LN: Zoom or WebEx and then come in to cast their vote one at a time in isolation so that they’re not around each other.

GS: Yeah, I think that’s … They should be investigating a lot of different options, but they’re not

LN: Why is the president standing next to his advisors, you know, within a foot of them. You have the vice president, the president. They’re all standing next to each other. They should be … The need to have everyone crammed into the White House briefing room, they could be using technology and spacing out so that people aren’t on top of one another.

GS: Yeah, I mean, even if you noticed the media on TV, when you’re watching the news and whatnot, like-

LN: So they have one blank seat. But that’s not six feet away.

GS: No, but I’m saying the media on TV has got separation, like this morning I’m watching NBC on morning news, and they’ve got them sitting. You know, it’s just a wider angle for the camera, and it wouldn’t be that difficult because I’ve noticed the same thing in every press briefing I see, whether it’s the president or the governors, or any of them. There is a kind of a cluster of people around them, which is typical of the way it used to be and it’s not advisable now.

LN: Yeah, but it’s certainly something that should be looked at. I think it’s important that we do everything we can to keep the infection rate from spiking quickly. We know in Italy, when it spiked the way it was, the death rate goes up to 10%.

GS: Yeah, Italy is, it’s scary because everything they have done, they, unfortunately, got … got into it a bit late because they kept their borders open way too long and they allowed things to kind of transpire that now puts them into, you know, the situation being number two as far as fatalities and as far as case rate. Once they started, and they’ve shut down the entire country, now they’re actually shutting down the transportation systems within the country to try to contain this.

LN: It’s something else. And then with spring break, all the students coming back from Florida, California. They’re all at the beaches. This is going to transfer, and they’re going to be bringing their family members a special gift home.

GS: Yeah, it scares me about the fact that we allowed the spring break festivities to go on the way they did, that the governors weren’t a little bit more proactive in that regard, and that the people themselves… Granted, you’re young, you feel like you’re invincible. But the reality is, you’re not. And the once-in-a-lifetime spring break is not all that great as it is. Having not gone to any spring breaks when I was in school, other than the trip out West and whatnot, but … the value of it is far offset by the jeopardy you put yourself in from a health standpoint.

LN: Yeah, absolutely. Well, thanks for coming on the show again to talk about this.

GS: Great, enjoyed it. Well, I’m sure we’ll see each other again virtually.

Other Related Videos

View John Hopkins Coronavirus Map

https://coronavirus.jhu.edu/

View CDC Guidelines

https://www.cdc.gov/coronavirus/2019-ncov/faq.html#anchor_1584386949645

View State of Illinois Website

https://www2.illinois.gov/

Coronavirus Impact on States that Shelter at Home

President and CEO of Enigma Forensics, Lee Neubecker remotely converses with Geary Sikich, President of Logical Management Systems, to discuss the current state of impacts the Coronavirus has brought to citizens taking shelter at home. Data experts Lee and Geary explain statistics state by state and expose interesting facts for those states that have implemented shelter at home policies.

The Transcript of the Video Follows.

Lee Neubecker: I am here today, again with Geary Sikich, reporting from my basement. Geary is the principal of logical management systems. I am the president of Enigma Forensics. We’ve been talking on our show previously about the Coronavirus and the impact. And today we’re going to be talking a little bit about the current data trends and what’s happening. Geary thanks for being on the show remotely.

Geary Sikich: Thanks Lee it’s kind of an interesting way to work.

LN: It’s the new reality probably for a while, huh?

GS: I think for, yes, a little bit more than two weeks that’s for sure.

LN: Yeah, so I want to pull up some of the data that we were talking about earlier. A spreadsheet that we had here. Is that up on the screen for ya?

GS: Yes.

LN: Okay, great. So it’s showing that, this is data that was obtained from the John Hopkins website. They’ve got a place where you can download the historical data. Which I showed you a little earlier. Let me just pull that up. So what you see here, you can go on the map tool. You can actually scroll by clicking on the tab. Internet’s running a little slow. We discussed that previously.

GS: Welcome to the world of not enough pipe.

LN: Yeah so you might not have noticed it but there’s a little section that says admin one. If you hit the right arrows you can scroll through and cycle through and see the data reported differently. First it’s by country, and we’re now at 41,708 in the US. When you click, you can see the total. It’s running very slow today.

GS: Yeah John Hopkins, I know that one of the issues with their website is so many people are using it. That it, by this time of day it starts to slow down a bit. So it’s kind of a challenge to get in there and see the data as it stands. But I just noticed on the statistics for today, that the US stats at noon, when I checked I was doing a webinar today on hospital pandemic planning and drills. And US infection rate has jumped up pretty substantially.

LN: Yeah I want to show you some specifics of concerns as we drill down. I pulled the top 10 states And you can click here, you can see by states and regions. You can see New York is getting devastated right now. Then Washington, and then Cook County Illinois here is running right up next in line. But what I found interesting is as you pull the historical data out, but you can get off, we can see, here is New York. That’s a pretty scary curve, and it’s a trajectory that doesn’t suggest it’s going to get any better any time soon. And then you have Illinois, New Jersey, and what not. But what was real interesting is we had a cross. Illinois is this line right here on the screen there. Illinois is, where is Illinois here. We got, actually what I did is I pulled out New York so I could get more zoned. So excluding New York, you can now see what’s going on. And Michigan, that didn’t have a band until they just announced today that they’re instituting a lockdown. But Illinois, more dense, more likely to get a contagious outbreak than Michigan in my opinion. Because they quarantined early enough, you start to see that at least so far Illinois holding out. Now I think that number’s going to jump up. I think that the number, they haven’t fully reported the count for today yet. But it was interesting to see both Louisiana and Michigan and Florida jump up and surpass. And right now, Florida doesn’t have a ban in place. Georgia doesn’t have a ban in place. What do you think’s going to happen with Georgia?

GS: Well I think what your statistics are showing, and it’s interesting is that the early adopters of shelter in place and working remotely, etcetera, cut the bands, if you will. The early adopters of that are finding that social distancing is actually working. The late adopters who have yet to come to the point of doing shelter in place and what not are finding much like the parallel with Philadelphia and Denver during the Spanish Influenza, Denver closed the city very quickly, very little in terms of issues that they had. Philadelphia on the other hand kept everything open and actually did a parade to try to raise money for bombs for World War One. And as a result they had a significantly higher infection rate. And so I think you’re seeing a parallel in terms of history and what’s happening today. So I would say that those states that are late adopters are probably going to see a higher rate of infection. The other thing it would be, is if we can, you’d have to do some manipulation on data with this but is to look at those states which have large cities. Chicago, New York City, Los Angeles. Some of the bigger cities are going to have a significantly bigger concentration of casualties, if you will. That is going to result, it results from the fact that people are living in close proximity in those cities. The other aspect is that, if you think about it, a lot of downtown populations don’t have the, how do I put it, the infrastructure to do a lot of at home cooking. So it’s either they don’t have the storage facilities for food or they just don’t cook because restaurants are so plentiful. And suddenly we’re finding that with restaurants closed and other things being shut down, as far as businesses and what not, that there’s a greater dependence for people to be a little bit more self-sufficient, if you will.

LN: Yep, it’s certainly going to get interesting here. Well, thanks for coming on the show again and talking about this. I’m sure we’ll have some more things to talk about again soon.

GS: Thank you for having me.

LN: Great, thanks.

Other Related Videos

View John Hopkins Coronavirus Map

https://coronavirus.jhu.edu/

View CDC Guidelines

https://www.cdc.gov/coronavirus/2019-ncov/faq.html#anchor_1584386949645

View State of Illinois Website

https://www2.illinois.gov/

Coronavirus: The Global Impact

Coronavirus is here and leaving death and destruction in its path. Lee Neubecker and Geary Sikich uncover the Coronavirus and its global impact on businesses worldwide and what it means for us here at home in Chicago.

Coronavirus is here and globally impacting our world. Human beings are dying and the toll keeps rising more and more each day. That is the horrible truth of disease! Besides causing human pain and suffering the Coronavirus is also causing disruption and impacting many businesses that are dependant on each other. What does the impact look like? Forensic Expert Lee Neubecker and President of Logical Management Systems Geary Sikich dissect Coronavirus and the huge global rippling impact. For example; Chicago recently canceled the Housewares Show at McCormick Place which typically draws over 60,000 attendees. Everything associated with that conference will feel a significant downturn. ie. hotels, travel, transportation, local food, and beverage. As a result of this global business disruption, there will also be an increase of vulnerability and these experts anticipate an increase in cyber activity. Watch this video interview to learn more about other global industries impacted by the Coronavirus.

Part 1 of our 2-Part Series on Coronavirus

Coronavirus Series: Part 1 is about The Global Impact

Lee Neubecker: I’m here today with Geary Sikich. He’s the president of Logical Management Systems, a cyber and business continuity consulting expert. And I’m Lee Neubecker, the president of Enigma Forensics. We’re a computer forensics firm that provides investigative assistance with matters involving litigation or otherwise investigations. Today we’re going to be talking about the Coronavirus and the global impacts. Thanks, Geary, for being on the show.
Geary Sikich: Thanks, Lee, for having me back.

LN: So, Geary, can you tell everyone what’s happening right now globally, as it relates to the business environment in impacted nations?

GS: Well, the current state of affairs is that Asia is in a situation where Coronavirus continues to kind of expand. It’s expanding at a lesser pace in China, but it’s accelerated in places like South Korea and in Japan. And we’re starting to see it, obviously, move from those Asian countries into the Middle East. Iran has a huge issue with Coronavirus. Italy has another big amount of people that are confirmed cases versus cases under observation. So there’s a significant amount of human impact there. On the business side, this has disrupted a lot of businesses in just about every way you can imagine. So, the shipping industry? Tremendous disruption there. Airline industry? Tremendous disruption there. A lot of flight cancellations and other things. We’re seeing now sporting events, conferences, conventions, all kinds of things that are essentially money-makers in the normal sense, but also dependent on a tremendous chain of support to bring off. Suddenly a conference is canceled, and now you have hotels affected, you have transportation systems affected, you have all the food services affected. This kind of rippling through a lot of areas is causing a very very big concern with, not only businesses but governments. How do you control it and what do you do in this situation?

LN: So, here in Chicago, we have the Chicago Housewares Show canceled. Recently many vendors were coming from other nations where there’s a travel ban. And that impact certainly impacts the workers that are at the hotels, The audio workers.

LN: And whatnot, their hours get cut.

GS: Yeah, the interesting part about that is that when you begin to look They had on the news the other day, They had on the news the other day, was talking about the cancellation of this convention. 60,000 people come. And obviously there’s a lot of work that’s done: Setting up booths, displays, and all the other things that go along with it. Suddenly, he’s out of work for a period of time until the next convention comes in or maybe doesn’t come in. But that ripples through to hotels, food services, restaurants, your taxi cabs, your Ubers, your Lyft, your everything associated with coming to a place for a conference or a convention. So a huge impact. But then you also have So huge impact.

LN: But then you also have and these deliveries are now delayed because of the dockworkers that load up the equipment

GS: Systems.

LN: And these deliveries are now delayed where they have restrictions in place.

GS: And an interesting sidelight to that is that you look at the shipping industry and the amount of material that’s shipped by the containers those ships carry are what they call 20,000 TEU which is a 22-foot equivalent unit. Or 20-foot equivalent unit. Anyway, it’s a size that they have. If you look at that aspect, one of the things that some companies are starting to encounter, and I think you’re going to see more and more of this, is that because of delays in shipping, suddenly the container supply is not as available because your container, Lee, that you shipped, full of your product is sitting out in the ocean waiting to dock at my port, but it can’t come in because it’s quarantined? And now that container is going to sit. But John’s company needs a container to ship his product. Can’t get it because your container’s the one he would’ve normally gotten. So huge impacts in terms of ripple effects in a lot of it. So the average time that the container holds goods, in terms of the number of days is increased markedly. And the existence of the containers largely

LN: So the average time that the container holds goods, so there’s a shortage. Right. And if you think about this in another context, the number of things in the containers, it’s not just computer chips,

GS: Right. Roughly, and I heard a figure that was kind of astounding to me, but about 80% of all the containers are full of perishable foods.

LN: Oh yeah, certainly.

GS: You’ve got your bananas, and oranges and things that we don’t necessarily get in Chicago in the wintertime ’cause we don’t grow them.

LN: Oh yeah, certainly.

GS: You’ve got your bananas because it’s no longer fresh. I’ve got to decontaminate the container. because we don’t grow them, in terms of how these all are impacted. Which gets us into looking at, from a computer security standpoint. These are tracked. Barcoding systems and whatnot. How easy is it for that to get disrupted because somebody decides it’s an opportunity to hack into a network?

LN: Certainly, when systems are constrained and overworked, it’s the likelihood of a failure or an attack compromising the system goes up. So it creates a real opportunity for a hacker to strike and have a magnified impact, So here in Chicago, we have a lot of companies that are impacted by this. We’ve got Boeing, We’ve got United Airlines. Boeing. Major facilities for companies that, while headquartered elsewhere, operate big hubs out of Chicago. Especially in the airline industry.

GS: United Airlines. still, kind of the shipping center for a lot of the country. And if you look at the Chicago area, if you will, you’ve got then industries in Northwest Indiana, you’ve got industries south of Chicago.

LN: Rail.

GS: A huge amount of rail traffic that goes through. The expressway between Indiana and Chicago, 80, 94, is one of the heaviest traveled expressways in the world. You’ve got a number of other businesses that suddenly have the exposure that they hadn’t realized. A huge amount of rail traffic that goes through. What would happen if you took the casinos in the Chicago area and closed them down for two weeks? It’s not just casino workers. It’s not just the amount of money the casino’s going to lose by not being in operation. It’s the day worker. It’s what we call the gig economy. Those people who live paycheck to paycheck that are dependent. So suddenly, they’re without. How are we going to deal with making sure that there’s a, if you will, an equilibrium or a safety net for those entities? One of the things we’re faced with, starting to see now, the City of Chicago’s just announced they’re just putting together a pandemic taskforce. They’ve had a few months watching it unfold in China. much like the rest of the United States, and, if you will, the rest of the world in some respects. Why has it taken this amount of time, and what do we need to be aware of from a private-sector standpoint as to what the public sector is going to do? So from a planning standpoint, this is critical. If you’re a business and you’re putting together a plan, and your plan suddenly conflicts with the City’s plan or the State’s plan, what happens then? How do you deal with that?

LN: Those are all great points. In our next segment, we’ll be continuing our discussion, and we’ll be talking a little bit more about what it’s been like for businesses that are going through some of these extreme measures that are being put in place to help protect and contain the virus from spreading. Thanks for being on the show.

GS: Thanks, Lee.

Other related articles

City of Chicago’s response

https://www.chicago.gov/city/en/depts/cdph/provdrs/health_protection_and_response/news/2020/march/public-health-officials-announce-new-presumptive-positive-case-o.html

For information about how you can prepare from the Center Disease Control.

https://www.cdc.gov/coronavirus/2019-ncov/community/index.html